 Global| Mar 23 2009
Shrinking World Trade: Evidence From Euro Area
Summary
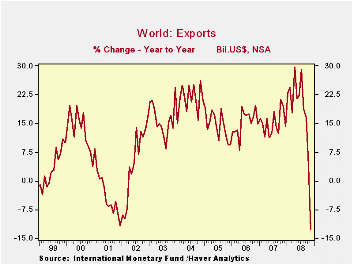
World trade began to decelerate early in 2008 reflecting the impact of the world wide slow down, but did not actually decline until November, the latest data available in Haver's IFS (International Monetary Fund Data) database. As [...]

World trade began to decelerate early in 2008 reflecting the impact of the world wide slow down, but did not actually decline until November, the latest data available in Haver's IFS (International Monetary Fund Data) database. As shown in the first chart, the year-to-year decline in world exports was 13% in November. Since then more countries have released trade data most of it suggesting further sharp declines.
 Today foreign trade data for the Euro Area, as a whole, was
released for January 2009. (The data exclude intra euro area trade.)
Eurostat reported that the sixteen country area experienced
year-to-year declines of 7% in exports in December and 22% in January.
It also reported its second highest trade deficit of 5,460 million
euros with the rest of the world.
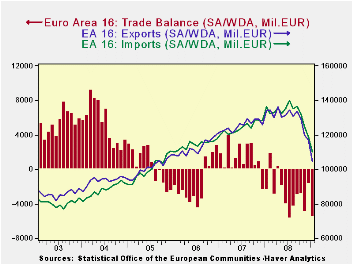
  The balance of trade in the area has
fallen rapidly since February 2008, when the last appreciable surplus
was registered. Exports fell 29,815 million euros and imports fell
22,505 million euros resulting in a deterioration of 7,310 million
euros in the balance of trade--from a surplus of 1,850 million euros to
a deficit of 5,460 million euros. The trends in exports, imports and
the balances can be seen in the second chart.
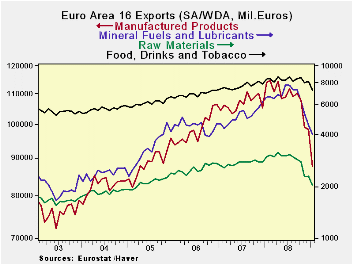
Manufactured exports were the hardest hit as can be seen in
the third chart that shows exports of manufactured products,  mineral
fuels and lubricants, raw materials and food, drink and tobacco on a
log scale where changes reflect percentage changes.
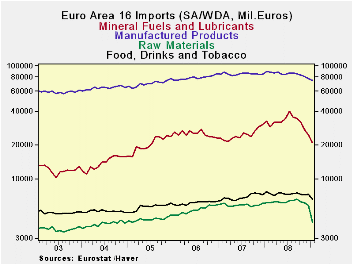
The rise and fall in oil prices that accounted for the sharp rise and fall in fuel imports over the past few years is evident in the fourth chart, also on a log scale. The peak in imports of fuels was reached in July 2008.
| EURO AREA-16 (Million Euros) | Jan 09 | Feb 08 | Change | 2007 | 2008 |
|---|---|---|---|---|---|
| Exports | 104550 | 134365 | -29815 | 1561690 | 1505903 |
| Imports | 110010 | 132515 | -22505 | 1592935 | 1490001 |
| Balance | -5460 | 1850 | -7320 | -31245 | 15902 |
| Manufactured Products Exports | 87736 | 114590 | -26854 | 1306908 | 1280612 |
| Mineral Fuels, & Lubricants Imports | 21068 | 39644* | -18576 | 385314 | 297024 |
| * July 2008 Peak |


