 Global| Feb 14 2005
Signs of Increased Spending by Japanese Consumers and Less Pessimism
Summary
Retail sales in value terms in Japan are beginning to show some signs of life. While total retail sale in Japan declined almost 1% in December from November, spending on (1) fabrics, accessories and apparel, (2) motor vehicles, and [...]

Retail sales in value terms in Japan are beginning to show some signs of life. While total retail sale in Japan declined almost 1% in December from November, spending on (1) fabrics, accessories and apparel, (2) motor vehicles, and (3) household machinery and equipment in December, 2004 were up, respectively 2.9%, 2.6% and 2.5% over November and 4.0%, 0.7% and 1.6% over December, 2003. For the year as a whole motor vehicle spending was up 2.7%, the second year of positive change.It should be noted that the level of purchases of both Fabrics, apparel & accessories and Household machinery and equipment are still almost 20% below levels reached in 2000.
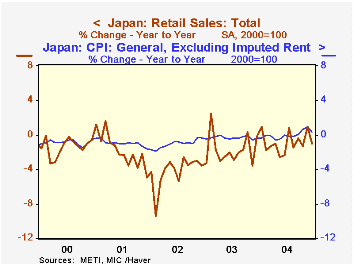
Deflation still plays a role in the decline of retail sales value, but its role is diminishing as can be seen in the first chart, showing the year-to-year changes in the value of retail sales and the year-to-year changes in the Consumer Price Index excluding imputed rent.
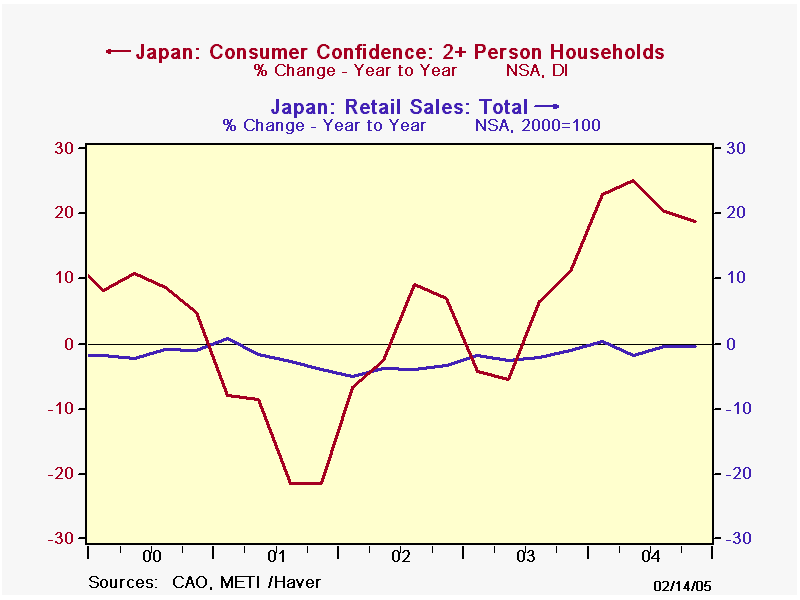
Not only have Japanese consumers been spending a bit more freely on selected items, but they are also becoming less pessimistic. While the second chart shows that there has been a slight decline in the year over year change in consumer confidence in recent quarters, the year over year growth remains impressive.
| Dec 04 | Nov 04 | Dec 03 | M/M % | Y/Y % | 2004 | 2003 | 2002 | |
|---|---|---|---|---|---|---|---|---|
| Retail Sales (SA, 2000=100) | 91.0 | 91.7 | 91.9 | -0.76 | -0.98 | -0.88 | -1.69 | -4.26 |
| General merchandise | 86.7 | 98.5 | 89.4 | -3.13 | -3.02 | -2.81 | -2.87 | -2.83 |
| Fabrics, apparel & accessories | 81.2 | 78.9 | 78.1 | 2.92 | 3.97 | -1.71 | -5.49 | -8.10 |
| Food and beverages | 92.2 | 96.3 | 98.1 | -4.26 | -6.01 | -1.33 | 0.45 | -1.95 |
| Motor vehicles | 99.9 | 97.4 | 99.2 | 2.57 | 0.70 | 2.67 | 1.19 | -4.97 |
| Household machinery and equipment | 81.1 | 79.1 | 79.8 | 2.53 | 1.63 | -3.17 | -4.93 | -9.15 |
| Other | 93.2 | 94.2 | 90.2 | -1.06 | 3.33 | -0.39 | -2.76 | -4.74 |
| Consumer Prices Index (2000=100) | 98.1 | 98.6 | 92.9 | 0.51 | 0.20 | -0.01 | -0.26 | -0.92 |
| Q4 04 | Q3 04 | Q4 03 | Q/Q % | Y/Y % | 2004 | 2003 | 2002 | |
| Retail Sales (NSA 2000=100) | 96.9 | 90.0 | 97.4 | 7.67 | -0.48 | -0.60 | -1.90 | -3.96 |
| Consumer Confidence % Balance | 45.6 | 45.8 | 40.5 | -0.44 | 12.59 | 17.84 | 2.03 | 1.30 |
More Economy in Brief
 Global| Feb 05 2026
Charts of the Week: Balanced Policy, Resilient Data and AI Narratives
by:Andrew Cates


