 Global| Sep 04 2007
Slovakia Continues its Fast Pace of Growth: Difference Between Eurostat and Country Sourced Data
Summary
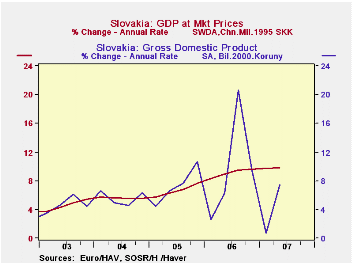
The economy of Slovakia grew 9.4% at an annual rate in the second quarter of this year according to Eurostat data (J936GDPT@EUROSTAT), and 7.52% according to the country sourced data (F936NGPC@EMERGECW). The first chart shows the [...]

The economy of Slovakia grew 9.4% at an annual rate in the second quarter of this year according to Eurostat data (J936GDPT@EUROSTAT), and 7.52% according to the country sourced data (F936NGPC@EMERGECW). The first chart shows the annual rates of change in the two series. The Eurostat data are based on 1995 Koruna, while the country sourced data are based on 2000 Koruna; however, that is a matter of scale and should not affect percentage changes. A more substantive difference between the two series arises from the fact that the Eurostat series is working day adjusted and has been harmonized. A comparison of the quarterly annual rates of change in the two series, suggests that the working day adjustment and perhaps other seasonal factors could account for the quarterly differences in the two series since the quarterly differences appear to average out as the annual changes are virtually the same in both series as shown in the table below
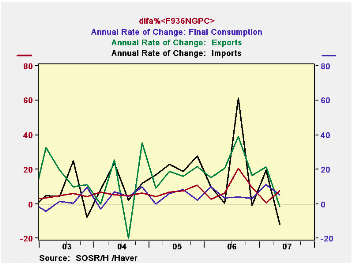
Eurostat has, so far, released data only for total GDP for the second quarter, while the country data show the composition of GDP in the second quarter. Consumption increased 5.1% at an annual rate in the second quarter and while exports declined by almost 2%, imports were down almost 12%. The biggest spur to growth was an annual rate of increase of 33.5% in gross capital formation as can be seen in the second chart and in the table below.
| SLOVAKIA | Q2 07 | Q1 07 | Q2 06 | Q/Q DIF | Y/Y DIF | 2006 | 2005 | 2004 |
|---|---|---|---|---|---|---|---|---|
| Real GDP Growth (Annual Rate) | ||||||||
| Eurostat Data | 9.84 | 9.76 | 8.98 | 0.86 | 0.78 | 8.27 | 6.04 | 5.42 |
| Country Sourced Data | 7.52 | 0.72 | 6.29 | 6.80 | 1.23 | 8.28 | 6.03 | 5.41 |
| Personal Consumption Expenditure | 5.08 | 11.37 | 3.34 | -6.29 | 1.74 | 5.61 | 5.01 | 3.58 |
| Gross Capital Formation | 33.55 | -43.55 | 4.45 | 77.10 | 29.45 | 8.20 | 18.66 | 14.20 |
| Export | -1.87 | 21.30 | 20.36 | -23.17 | -22.23 | 20.71 | 13.78 | 7.87 |
| Imports | -11.92 | 19.56 | 0.13 | -31.47 | -12.05 | 17.78 | 16.62 | 8.83 |
More Economy in Brief
 Global| Feb 05 2026
Charts of the Week: Balanced Policy, Resilient Data and AI Narratives
by:Andrew Cates


