 Global| Nov 28 2006
Some Haver Sources to Monitor the Ups and Downs of the U. S. Dollar
Summary
The recent rapid fall of the U. S. dollar, particularly against the Euro and the British Pound has sent tremors in the financial world. Is this the beginning of a more extended fall in the dollar? Will China change its policy of [...]
The recent rapid fall of the U. S. dollar, particularly against the Euro and the British Pound has sent tremors in the financial world. Is this the beginning of a more extended fall in the dollar? Will China change its policy of minimal appreciation? What will be the impact on the recovery in Europe? What will be the impacts on the U. S. consumer and on U. S. inflation? How will central banks react? While this short note cannot begin to address these questions, what it can do is point to some of the data that will provide useful background.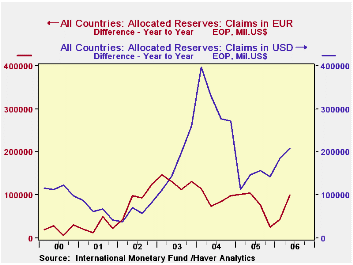
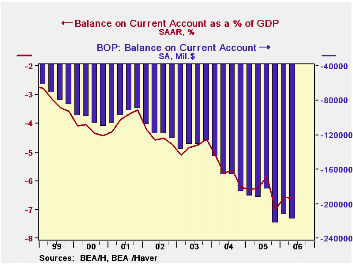
A root cause of the dollar's decline is the enormous U. S. balance of payments deficit as shown in the first chart and found in the Haver data bases USECON and USINT. Currently the deficit is 6.6% of Gross Domestic Product. However, the threat to the dollar from this source has been kept at bay, by the willingness of those countries with whom the U. S. has a deficit to hold their surpluses in dollar denominated instruments. Some of these countries are beginning to diversify their holdings from dollar assets to particularly euro assets. Of the allocated reserves published by the International Monetary Fund and reported in the Haver data base IFS, the year to year increases in the dollar and euro holdings are shown in the second chart. While the year to year increases in dollar holdings still exceed those of euro holdings, the excess increase of dollar holding has declined significantly since early 2005. Data on the major foreign holders of U. S. Treasury securities are found in the Haver data base USINT, Chart three shows the annual changes in the holdings of US Treasuries by China and Japan. While China has reduced its annual additions Japan has actually been reducing its holdings.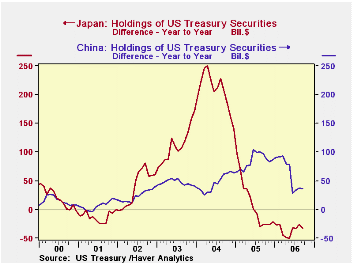
Finally, the movement of exchange rates can be monitored using the Haver data bases DAILY and INTDAILY. The recent fall of the dollar has been uneven with Europe bearing the major appreciation. The Euro hit a recent low relative to the U. S. dollar on October 10 when the euro was equivalent to 1.2502 U.S. dollars. In the month and a half since then, the euro has appreciated 4.9% to 1.312. The UK pound has appreciated almost as much, 4.4%, and now stands at $1.9369. The changes in Asian currencies have been more varied and more muted. The Japanese Yen, the South Korean Won, the Thai Baht, the Singapore dollar and the Indian Rupee have appreciated between 2.5 and 3.1% during this period. The Malaysian ringgit appreciated 1.74% and the Philippine peso, 0.80%. Among the Greater China group, the Taiwan dollar appreciated 1.19%, the Chinese Yuan 0.86% and Hong Kong a mere 0.22%.
| EXCHANGE RATES | Oct 10 06 | Nov 27 06 | Appreciation % |
|---|---|---|---|
| Euro (U.S. Dollar) | 1.2502 | 1.3120 | 4.94 |
| UK Pound (U.S. Dollar) | 1.8548 | 1.9368 | 4.42 |
| Japanese Yen (Yen/USD) | 119.18 | 116.12 | 3.07 |
| South Korea Won (Won/USD) | 959.2 | 930.3 | 3.11 |
| Thailand Baht (Baht/USD) | 37.46 | 36.44 | 2.80 |
| Singapore $ (S$/USD) | 1.5904 | 1.5494 | 2.65 |
| India Rupee (Rupee/USD) | 45.67 | 44.56 | 2.49 |
| Malaysia Ringgit (Ringgit/USD) | 3.693 | 3.630 | 1.74 |
| Taiwan $ (T$/USD) | 33.09 | 32.70 | 1.19 |
| Hong Kong $ (HK$/USD) | 7.7928 | 7.7760 | 0.22 |
| China Yuan (Yuan/USD) | 7.9100 | 7.8426 | 0.86 |


