 Global| May 23 2005
South Korea and Taiwan Report Slow Growth in the First Quarter of 2005
Summary
South Korea and Taiwan have recently reported first quarter Gross Domestic Product numbers. GDP in South Koreas increased 0.35% in the first quarter or at an annual rate of 1.41%. This was well below the annual growth rates of the [...]

South Korea and Taiwan have recently reported first quarter Gross Domestic Product numbers.
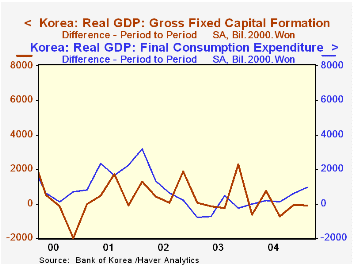
GDP in South Koreas increased 0.35% in the first quarter or at an annual rate of 1.41%. This was well below the annual growth rates of the past three years, of 4.7%, 3.2% and 7.0 respectively for 2004, 2003 and 2002. Much of the slow growth was due to a massive liquidation of inventories in contrast to inventory accumulation in much of 2004. In addition, fixed investment was down by 110.4 billion won. On the plus side were consumption which increased by 961.7 billion won and net exports of goods and services which increased by 4,845.5 billion won. The year to year changes in Fixed Investment and in Consumption for South Korea are shown in the first chart.
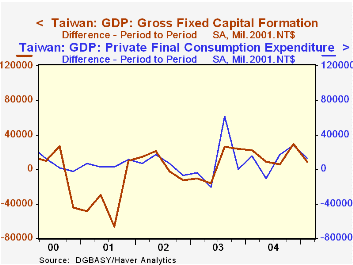
The quarter to quarter increase in GDP in Taiwan was 0.87% or 3.53% at an annual rate which was better than that of South Korea, but below Taiwan's growth of 5.71% in 2004. As in the case of South Korea, a major negative was a big inventory liquidation. In contrast to South Korea, fixed investment in Taiwan was a major positive. Increases in consumption and the net export of goods and services helped to offset the impact of the inventory liquidation. The course of the year to year changes consumption and fixed investment expenditures in Taiwan are shown in the second chart.
| Emerging Markets | Q1 2005 | Q4 2004 | Q3 2004 | Q2 2004 | Q1 2004 | 2004 | 2003 | 2002 |
|---|---|---|---|---|---|---|---|---|
| GDP (Period to Period) | ||||||||
| Taiwan | 0.87 | -0.48 | 2.31 | -0.09 | 1.07 | 5.71 | 3.33 | 3.94 |
| South Korea | 0.35 | 0.94 | 0.81 | 0.60 | 0.65 | 4.66 | 3.15 | 6.95 |
| GDP (Year over Year) | ||||||||
| Taiwan | 2.61 | 2.91 | 5.55 | 7.92 | 6.74 | |||
| South Korea | 2.72 | 3.03 | 4.91 | 5.28 | 5.17 | |||
| Change Q4 04 to Q1 05 | Taiwan (Mil 2001 NT$) | South Korea (Bil 2000 Won) | ||||||
| Consumption | 10776 | 961.7 | ||||||
| Fixed Investment | 9095 | -110.4 | ||||||
| Inventories | -40659 | -4742.6 | ||||||
| Net Export of Gds & Serv. | 44343 | 4845.5 | ||||||
| Stat. Discrepancy | -339.6 | |||||||
| Total | 23555 | 614.6 |
More Economy in Brief
 Global| Feb 05 2026
Charts of the Week: Balanced Policy, Resilient Data and AI Narratives
by:Andrew Cates


