 Global| Apr 28 2009
South Korea's GDP Increases in Q1 09, but is Still at Recession Levels
Summary
Although South Korea's real Gross Domestic Product improved slightly in the first quarter of this year, the economy is still in recession. GDP rose 0.21% at a seasonally adjusted annual rate (saar) in the first quarter of 2009, but it [...]

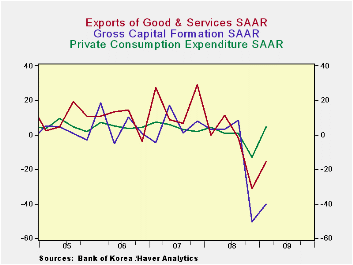
Although South Korea's real Gross Domestic Product improved slightly in the first quarter of this year, the economy is still in recession. GDP rose 0.21% at a seasonally adjusted annual rate (saar) in the first quarter of 2009, but it is 18.6%%, saars, below the third quarter of 2008. The fourth quarter of last year saw precipitous declines in practically every sector of the economy--the exception being an increase in Government Consumption expenditures.The table below shows the saars for the major components of GDP and the attached chart shows the saars for private consumption, gross capital formation and exports of goods and services. Gross capital formation suffered the biggest decline, 50.14% saar in the fourth quarter of 2008. Inventories were cut by 914 billion chained 2005 Won while expenditures on equipment declined at a saar of 45.80%. The decline in construction was a saar of 11.42%. Exports of goods and services declined by 32.2% while imports of goods and services declined at a saar of 45.8%
Government stimulus programs resulting in increased government consumption expenditures and construction spending were largely responsible for the increase in activity that took place in the first quarter. Private consumption improved slightly but private business spending on equipment continued to decline and there was a major liquidation of inventories amounting to 8.5 trillion chained 2005 won. The declines in exports and imports moderated in the first quarter but were still significant.
|
Seasonally adjusted annual rates of return ex where noted |
Q1 09 | Q4 08 | Q3 08 | Q2 08 | Q1 08 | 2008 | 2007 | 2006 |
|---|---|---|---|---|---|---|---|---|
| Gross Domestic Product | 0.21 | -18.78 | 0.97 | 1.72 | 4.38 | 2.22 | 5.11 | 5.16 |
| Private Consumption | 1.79 | -17.29 | -0.05 | -0.65 | 4.29 | 0.92 | 4.06 | 4.73 |
| Government Consumption | 15.23 | 4.11 | 4.30 | 4.83 | 4.97 | 4.21 | 5.39 | 6.58 |
| Gross Capital Formation | -40.34 | -50.14 | 8.34 | 3.04 | 3.16 | 0.80 | 3.55 | 4.42 |
| Construction | 23.06 | -11.42 | 0.23 | -1.23 | -9.73 | -2.10 | 1.44 | 0.53 |
| Equipment | -33.11 | -45.80 | 0.68 | 1.55 | -1.40 | -1.99 | 9.29 | 8.19 |
| Inventory Change (Bil. chained 2005 Won) | -8522 | -914 | 6376 | 4979 | 4512 | 14958 | 7210 | 10017 |
| Exports of Goods&Services | -15.64 | -31.20 | -1.62 | -11.34 | -0.11 | 5.73 | 12.61 | 11.37 |
| Imports of Goods&Services | -30.38 | -45.83 | 4.29 | 12.31 | -3.01 | 3.66 | 11.68 | 11.29 |


