 Global| Feb 02 2009
South Korean Exports Plummet: Sharp Fall in Exports to Pacific Rim
Summary
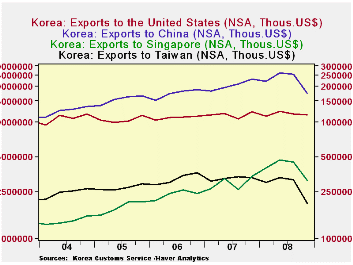
South Korea announced today that its January exports fell 32.7% below a year ago, the largest year to year percentage decline on record. Except for September 2007, when exports fell 1.1%, Korea's exports have shown double digit year [...]
 South Korea announced today that its January exports fell
32.7% below a year ago, the largest year to year percentage decline on
record. Except for September 2007, when exports fell 1.1%, Korea's
exports have shown double digit year to year percent increases in
 practically every month since July 2002 until November of last year
when double digit declines began to appear, as shown in the first chart.
Imports have also declined, but at a somewhat slower pace with
the results that the ten year stretch of South Korean trade surpluses
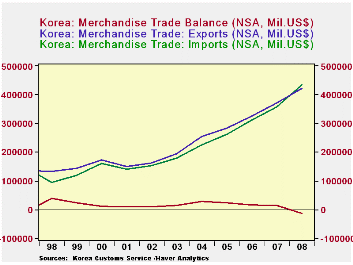
begun in 1998 has come to a stop.  There was a $12.7 billion trade
deficit in 2008, compared with a surplus of $14.6 billion in 2007.
Annual data for exports, imports and balances of trade from 1998
through 2008 are shown in the second chart.
| South Korea | Jan 09 | Dec 08 | Nov 08 | Oct 08 | Sep 08 | Aug 08 | July 08 | 2008 | 2007 |
|---|---|---|---|---|---|---|---|---|---|
| Exports (NSA, Bil US$) | 21.7 | 27.3 | 29.2 | 37.4 | 39.1 | 36.6 | 41.0 | 422.9 | 371.5 |
| Imports (NSA, Bil US$) | 24.7 | 26.8 | 28.9 | 35.8 | 39.4 | 40.1 | 43.7 | 435.6 | 356.9 |
| Balance (NSA, Bil US$) | -3.0 | 0.7 | 0.3 | 1.2 | -2.2 | -3.8 | -2.0 | -12.7 | 14.6 |
| Exports (Y/Y % Chg | -32.8 | -17.4 | -18.2 | 8.53 | 27.7 | 18.2 | 35.6 | 14.1 | 13.8 |
| Imports (Y/Y % Chg | -32.1 | -21.5 | -14.7 | 10.4 | 45.8 | 36.4 | 47.4 | 15.4 | 22.1 |
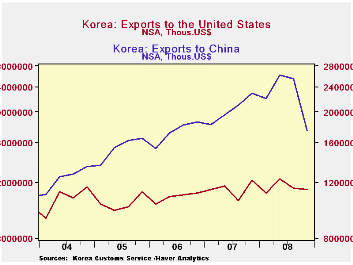
| Exports to US Y/Y % Chg | -- | -9.4 | -14.3 | 5.0 | 19.3 | 1.0 | 9.3 | 11.5 | 18.0 |
| To China Y/Y % Chg | -- | -36.4 | -33.7 | -3.5 | 15.0 | 19.3 | 30.1 | 3.2 | 10.6 |
| To Taiwan Y/Y % Chg | -- | -56.9 | -45.2 | -17.0 | 1.3 | -15.0 | -1.4 | -12.0 | 0.2 |
| To Malaysia Y/Y % Chg | -- | -30.5 | -21.4 | -24.8 | 8.2 | 10.8 | 27.6 | 1.6 | 9.1 |


