 Global| Feb 10 2009
Sweden's Activity Index Points to a 5% + Annual Rate of Decline in Fourth Quarter GDP
Summary
Sweden's Activity Index, published today is a monthly indicator of Gross Domestic Product. It is derived from a regression based on movements in industrial production, the number of hours worked by employees in the government sector, [...]

Sweden's Activity Index, published today is a monthly
indicator of Gross Domestic Product. It is derived from a regression
based on movements in industrial production, the number of hours worked
by employees in the government sector, sales in retail trade and
imports and exports. (The index is found in the BUSINESS CYCLE
INDICATORS AND SURVEY/FORECASTS section of the NORDIC
database )
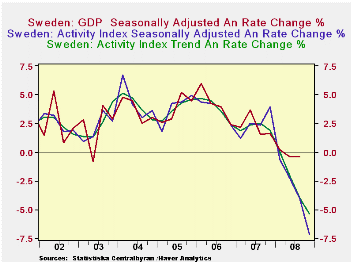
Statistics Sweden computes three indexes: unadjusted, seasonally adjusted and trend. The unadjusted Activity Index is calibrated so that its quarterly values are equal to the seasonally unadjusted GDP values indexed to 2000=100. The annual rates of changes in the seasonally adjusted and trend activity indexes track those in the seasonally adjusted GDP as can be seen in the first chart. These indicators suggest that the gradual annual rates of decline that have been taking place in Sweden's GDP in the last two quarters(-0.39% in the second quarter and -0.38% in the third quarter) are about to be substantially increased. The release of Sweden's fourth quarter GDP is scheduled for February 27, 2009.
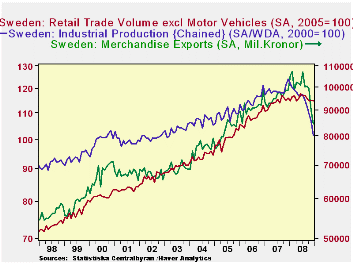
Among the larger components of the Activity Index, retail sales have performed better that either exports or industrial production in recent months, although they too have shown a declining trend. It has been Exports and Industrial Production that have largely been responsible for the recent sharp declines in the Activity Index, as can be seen in the second chart.
| SWEDEN | Dec 08 | Nov 08 | Oct 08 | Sep 08 | Aug 08 | July 08 |
|---|---|---|---|---|---|---|
| Activity Index SA (2000=100) | 117.23 | 118.03 | 119.40 | 119.98 | 120.21 | 121.19 |
| Month to Month % Change (SAAR) | -7.81 | -12.98 | -4.68 | -3.49 | -9.29 | 0.11 |
| Activity Index SA (2000=100) | ||||||
| Month to Month % Change (SAAR) | 118.1 | 118.7 | 119.3 | 119.9 | 120.4 | 120.4 |
| Activity Index % Change (SAAR) | 5.40 | 3.98 | 2.11 | 0.00 | 1.93 | 2.55 |
More Economy in Brief
 Global| Feb 05 2026
Charts of the Week: Balanced Policy, Resilient Data and AI Narratives
by:Andrew Cates


