 Global| Aug 02 2007
Swedish GDP Grows 1.0% in Q2, Led by Fixed Investment and Exports of Services
Summary
Sweden's GDP expanded by a 1.0% quarterly amount in Q2, Statistics Sweden reported this morning, a pickup from 0.7% in Q1. Year-on-year growth was 3.5%, compared to 3.0% in Q1. The gain during 2006 was 4.2%. Two demand sectors [...]

Sweden's GDP expanded by a 1.0% quarterly amount in Q2, Statistics Sweden reported this morning, a pickup from 0.7% in Q1. Year-on-year growth was 3.5%, compared to 3.0% in Q1. The gain during 2006 was 4.2%.
Two demand sectors dominated: fixed investment and exports of services. Investment actually slowed a bit from Q1, but at 2.0%, still had a sizable gain; Q1 had been 3.2%. The later figure is 9.2% ahead of the year earlier. The growth was concentrated in the private sector, which saw a 10.2% gain from Q2 2006. Consumer spending by households rose 0.6% in both Q1 and Q2 and was ahead of early 2006 by 2.5%, in line with the last several years. In the graph here, the "recession shading" covers periods of recession in Sweden, one of 17 countries besides the United States included in the "recession country" feature of DLXVG3; this item is not new, it's been part of Haver'sa software for several years. 
Sweden is a very "open" economy; its exports and imports added together made 97% of GDP in Q1, measured in nominal terms. For comparison, the EA-13 countries together have just over 80% of GDP involved with exports or imports, and in the US, the figure is a modest 28%. [All of these shares are calculated using nominal data in local currency.] So Sweden's trade is important. We see that the performance of exports during the first half of this year is divided: goods exports fell, by 0.2% in Q1 and 0.6% in Q2 [growth rates compare values in chained 2000 Swedish Kronor], while services surged by 3.1% in Q1 and 4.4% in Q2. These strong gains put Q2's volume of services exports more than 13% ahead of a year ago. They have increased at a double-digit year-on-year pace continuously since Q4 2003. 
On the import side, goods imports also fell in Q2, by 0.6%, although they had expanded 2.1% in Q1. Imports of services have also been growing, but not nearly as fast as exports. Their annualized growth has averaged 8.7% since the first quarter of 2005.
The detail in this early GDP report does not permit us to see which services exports are making for the category's strength. However, the data on value added by industry do show that the transportation & communications sector and the hotel-restaurant sector have seen sizable increases. So have the construction and business services industries. So Swedish firms working abroad or working for international clients are adding significantly to growth in Sweden, and it looks that travel and tourism in Sweden are also on the rise. Notably, unlike a number of other countries' economies, the finance and insurance sector has not experienced particularly vigorous expansion. It is keeping up, as seen in the last graph here, but it is not the growth leader as it is elsewhere. Sweden's comparative advantages lie in other areas.
| SWEDEN | Q2 2007 Q1 20072006 | 2005 | 2004 | ||||
|---|---|---|---|---|---|---|---|
| Qtr/Qtr* | Yr/Yr | Qtr/Qtr* | Yr/Yr | ||||
| Total GDP, Bil.SEK | 668.2 | 661.9 | 2595.6 | 2848.6 | 2415.1 | ||
| 1.0 | 3.5 | 0.7 | 3.0 | 4.2 | 2.9 | 4.1 | |
| Household Consumption | 0.6 | 2.5 | 0.6 | 2.5 | 2.8 | 2.4 | 2.2 |
| Gross Fixed Investment | 2.0 | 9.2 | 3.2 | 12.7 | 7.9 | 8.1 | 6.4 |
| Exports: Goods | -0.6 | 3.4 | -0.2 | 3.8 | 8.0 | 5.1 | 10.2 |
| Exports: Services | 4.4 | 13.2 | 3.1 | 10.7 | 10.7 | 11.5 | 14.4 |
| Imports: Goods | -0.6 | 7.4 | 2.1 | 10.6 | 7.7 | 7.9 | 7.6 |
| Imports: Services | 1.7 | 9.1 | 3.2 | 10.8 | 8.5 | 4.0 | 5.3 |
| GVA: Industry | 1.3 | 3.9 | 0.6 | 3.1 | 4.9 | 3.5 | 9.3 |
| GVA: Services | 1.6 | 4.3 | 0.7 | 3.8 | 5.5 | 3.8 | 2.7 |
by Robert Brusca August 2, 2007
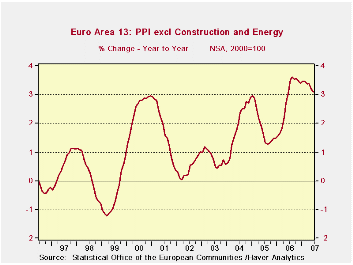
Headline rise in June is +0.1% after +0.3% in May.
Core trends pointing right directions but still at strong pace.
While the ECB may be happy with the direction for inflation, the pace is nonetheless too high and the rate of reduction is still slow (except in Italy where this partial ‘core measure’ of inflation is falling from a much higher pace).
For all of EMU, PPI excluding energy and construction peaked at 3.6% in August of 2006 and has edged lower to 3.1% in June of 2007. That’s a reduction of 0.5% in the annual rate over a period of 10 months. That means it will take this quasi-core measure ( Q-core) about 22 months to get back to the CEILING rate of acceptability at 2%. That is a long wait for an inflation rate that already has been over the 2% limit for 36 months already. It would make one-half of a decade that the ECB ‘allowed’ Q-core inflation to run at a pace above its expressed ceiling.
The various key countries in the second graph do not have characteristics much different from this.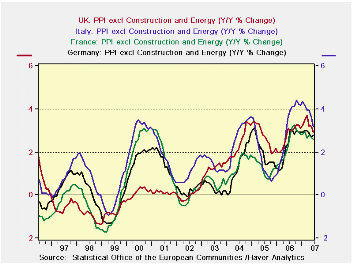
The table below gives us a sense of some of the details of the EMU PPI and some country level trends for overall and excluding energy PPI inflation. We express in RED those inflation rates where the pace is lower than in the previous period provided in the table. For example, nearly all categories and countries show inflation lower over the recent 12 months than in the previous 12 months. But only the UK shows inflation lower in the recent six month compared to the previous 12 months as well. And while some countries show lower inflation in the past three months than in the past six months, the general speed up for inflation in the six month pace compared to a year-ago does not make the current step down look like it is part of a fundamental trend. And that is a problem.
For the EMU PPI categories, only capital goods prices are below the 2% mark over three months although capital goods almost makes the grade for six months and the index is well below 2% for the past and previous 12 months. But this category stands alone in those respects. Capital goods prices have remained well behaved and have only one small and technical violation of the 2% ceiling. Of course I don’t mean to imply that the ECB ‘targets’ inflation below 2% for each price category; the rate ceiling applies to only headline inflation. But it is instructive to look at member countries as well as various categories to see where the outliers are.
Among countries only the Non EMU member EU-member UK has sequentially lower inflation rates with inflation falling steadily across all horizons in the table. UK ex-energy inflation trend does not do so well but it is on a better track than any EMU member.
On balance, neither overall nor country level trends in the PPI can encourage the ECB on inflation. And theses figure are for the PPI; services sector inflation, a key ingredient in national CPI (HICP) inflation rates is generally a bit more stubborn.
| M/M | SAAR | |||||
| EA 13 | Jun-07 | May-07 | 3-Mo | 6-MO | Yr/Yr | Y/Y Yr Ago |
| Total ex Construction | 0.1% | 0.3% | 3.8% | 3.8% | 2.3% | 5.8% |
| Excl Energy | 0.1% | 0.3% | 3.6% | 3.8% | 3.1% | 3.0% |
| Capital Goods | 0.0% | 0.1% | 0.7% | 2.1% | 1.9% | 1.3% |
| Consumer Goods | 0.2% | 0.2% | 2.7% | 2.6% | 1.6% | 1.8% |
| Intermediate &Capital Goods | 0.1% | 0.3% | 3.8% | 4.5% | 3.9% | 3.7% |
| Energy | 0.1% | 0.6% | 4.9% | 3.8% | -0.5% | 15.9% |
| MFG | 0.2% | 0.4% | 6.0% | 5.1% | 2.6% | 3.9% |
| Germany | 0.2% | 0.3% | 2.4% | 2.2% | 1.7% | 6.1% |
| Ex Energy | 0.2% | 0.2% | 3.3% | 2.9% | 2.8% | 2.4% |
| France | 0.2% | 0.2% | 3.6% | 3.4% | 1.9% | 3.9% |
| Ex Energy | 0.1% | 0.2% | 3.0% | 3.0% | 2.6% | 2.3% |
| Itlay | 0.2% | 0.4% | 4.4% | 3.9% | 2.8% | 6.2% |
| Ex Energy | 0.1% | 0.3% | 3.5% | 4.1% | 3.2% | 3.7% |
| UK | -0.2% | 0.2% | -7.6% | -7.1% | 0.6% | 9.8% |
| Ex Energy | 0.1% | 0.2% | 1.4% | 3.6% | 2.9% | 3.1% |
| EA 13 Harmonized PPI excluding Construction | ||||||
| The EA 13 countries are Austria, Belgium, Finland, France, Germany, Greece, Ireland, Italy, Luxembourg, the Netherlands, Portugal, Slovenia. | ||||||
| 6COLSPAN | ||||||
by Tom Moeller August 2, 2007
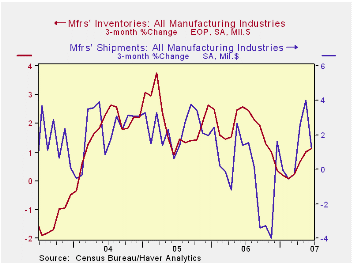
Factory inventories rose 0.3% during June following a 0.4% gain during May. While moderate, the increases are up from the 0.1% three month average growth ended February.
Growth in primary metals inventories picked up during the past three months as did growth in light truck inventories. Growth in inventories of nondefense aircraft & parts also has soared. In most other durable goods categories, however, growth in inventories has slowed recently. Many industries have seen outright decumulation such as in furniture and computers & electronic products. 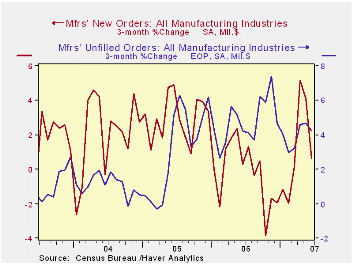
A slowdown in growth of factory shipments caused the recent inventory back-up. Shipments have fallen in three of this year’s months. For June the three month growth rate fell to 1.2%, helped by a 0.6% decline in June. The same pattern of recovery then a fall in growth is evident in shipments less the transportation sector.
Total factory orders rose 0.6% in June and that reversed the prior month’s 0.5% decline. Durable goods orders jumped 1.3%. The rise, however, only recovered some of the prior month’s 2.4% decline. Factory orders less transportation fell 0.5% (-1.3% y/y) while orders (shipments really) to petroleum refineries were unchanged (-5.5% y/y.
Unfilled orders continued their rise with a 1.4% gain during June. Less the transportation sector, where backlogs of civilian aircraft are up 43.3% y/y, backlogs rose 0.1% (9.6% y/y).
| Factory Survey (NAICS) | June | May | Y/Y | 2006 | 2005 | 2004 |
|---|---|---|---|---|---|---|
| Inventories | 0.3% | 0.4% | 3.7% | 6.4% | 8.9% | 7.7% |
| New Orders | 0.6% | -0.5% | -0.7% | 5.1% | 11.6% | 6.9% |
| Shipments | -0.6% | 0.8% | -0.9% | 4.3% | 10.3% | 6.9% |
| Unfilled Orders | 1.4% | 0.9% | 19.6% | 20.0% | 15.0% | 3.9% |
by Tom Moeller August 2, 2007
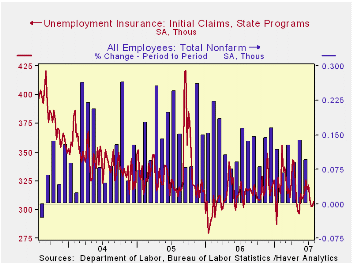
Initial unemployment insurance claims rose slightly last week. The 4,000 increase to 307,000 was the first uptick in five weeks. It followed an upwardly revised no change w/w during the prior period.
A claims level below 400,000 typically has been associated with growth in nonfarm payrolls. The jobs figure will be released tomorrow.
During the last ten years there has been a (negative) 78% correlation between the level of initial claims and the m/m change in nonfarm payroll employment. 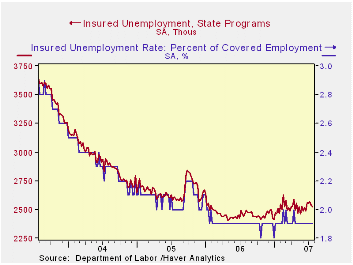
The four-week moving average of initial claims fell to 305,500 (-2.3% y/y).
Continuing claims for unemployment insurance fell 16,000 after a revised 22,000 decline during the prior week. The continuing claims numbers lag the initial claims figures by one week.
The insured rate of unemployment was stable at 1.9%.
A Brain Drain or an Insufficient Brain Gain? from the Federal Reserve Bank of New York can be found here.
Consensus expectations had been for a rise to 310,000 claims.
| Unemployment Insurance (000s) | 7/28/07 | 07/21/07 | Y/Y | 2006 | 2005 | 2004 |
|---|---|---|---|---|---|---|
| Initial Claims | 307 | 303 | -2.5% | 313 | 331 | 343 |
| Continuing Claims | -- | 2,525 | 3.5% | 2,545 | 3.3% | 2,459 |
by Tom Moeller August 2, 2007
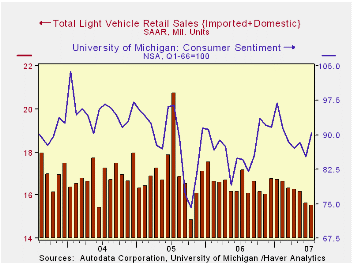
During July, U.S. sales of light vehicles fell for the seventh consecutive month this year. The decline was attributed by manufactures to spillover effects from weak housing & construction activity.
The 0.4% m/m decline to an annualized selling rate of 15.5M units, according to the Autodata Corporation, was slight but it dropped sales nearly 10% below the year earlier level. The decline was to the lowest since October 2005.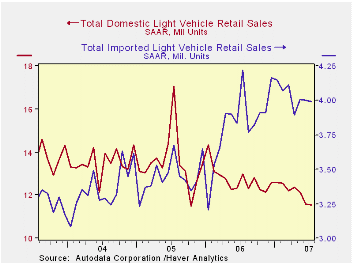
Sales of imported vehicles dropped a very slight 0.2% m/m to 3.99M (-5.3% y/y), again propped up by sharp discounting. Sales of imported cars ticked up by 0.6% m/m but that was not enough to prevent an 8.6% decline versus a year ago. Sales of imported light trucks fell 1.7% m/m (+1.5% y/y).
Domestic car sales again suffered a steep decline with a hard 5.4%m/m drop (-11.2% y/y). Sales of domestic light trucks recovered a bit of the prior two month’s steep declines with a 3.3% m/m increase (-10.8% y/y).
U.S Exporters: A Rare Breed from the Federal Reserve Bank of St. Louis is available here.
| Light Vehicle Sales (SAAR, Mil. Units) | June | May | Y/Y | 2006 | 2005 | 2004 |
|---|---|---|---|---|---|---|
| Total | 15.54 | 15.60 | -9.6% | 16.55 | 16.96 | 16.87 |
| Autos | 7.37 | 7.63 | -10.3% | 7.77 | 7.65 | 7.49 |
| Trucks | 8.16 | 7.97 | -8.9% | 8.78 | 9.32 | 9.37 |
Carol Stone, CBE
AuthorMore in Author Profile »Carol Stone, CBE came to Haver Analytics in 2003 following more than 35 years as a financial market economist at major Wall Street financial institutions, most especially Merrill Lynch and Nomura Securities. She had broad experience in analysis and forecasting of flow-of-funds accounts, the federal budget and Federal Reserve operations. At Nomura Securities, among other duties, she developed various indicator forecasting tools and edited a daily global publication produced in London and New York for readers in Tokyo. At Haver Analytics, Carol was a member of the Research Department, aiding database managers with research and documentation efforts, as well as posting commentary on select economic reports. In addition, she conducted Ways-of-the-World, a blog on economic issues for an Episcopal-Church-affiliated website, The Geranium Farm. During her career, Carol served as an officer of the Money Marketeers and the Downtown Economists Club. She had a PhD from NYU's Stern School of Business. She lived in Brooklyn, New York, and had a weekend home on Long Island.
More Economy in Brief
 Global| Feb 05 2026
Charts of the Week: Balanced Policy, Resilient Data and AI Narratives
by:Andrew Cates


