 Global| Nov 20 2006
Taiwan and Singapore Report 3rd Quarter Gross Domestic Product
Summary
Seasonally unadjusted GDP data are available for the third quarter for Taiwan and Singapore. The year-over-year increase in real Taiwanese GDP in the third quarter was 4.4% while the nominal increase was 3.5% implying a decline in the [...]
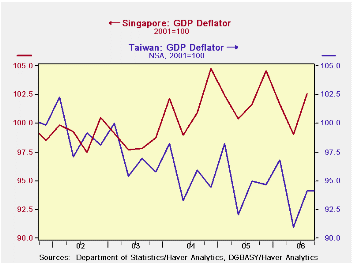
Seasonally unadjusted GDP data are available for the third quarter for Taiwan and Singapore. The year-over-year increase in real Taiwanese GDP in the third quarter was 4.4% while the nominal increase was 3.5% implying a decline in the deflator. While most other countries in the Asian Pacific region--even Japan--have seen a reversal of price trends from declines to modest increases, Taiwan is still experiencing declines. The year-over-year change in the deflator for Taiwan is compared with that of Singapore in the first chart. While both countries show considerable variation in the year-over-year changes in the deflators, there is a clear downward trend in the Taiwan data and a slight upward trend in the Singapore data.
Real growth in Taiwan increased 4.4% in the third quarter. So far this year growth has been steady at around the 4 plus percent level. Growth in Singapore, on the other hand, has declined over the year from 10.7% in the first quarter to 8.2% in the second and 7.2% in the third. The year-over-year growth in real GDP for the two countries is shown in the second chart.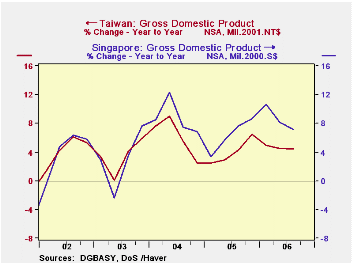
Taiwan and, particularly, Singapore are two of the smaller nations of the Pacific Rim. In dollar terms, the GDP of Taiwan is currently about $88 billion and Singapore, $33 billion, compared to Japan's $1.1 trillion. They have been, however, among the faster growing nations in the East.
| Q3 06 Y/Y % | Q2 06 Y/Y % | Q 1 06 Y/Y % | 2005 % | 2004 % | 2003 % | 2002 % | 2001 % | |
|---|---|---|---|---|---|---|---|---|
| TAIWAN GDP | ||||||||
| Current NT$ (NSA) | 3.37 | 3.35 | 3.47 | 3.49 | 4.38 | 1.22 | 3.37 | -1.69 |
| Real 2001 NT$ (NSA) | 4.92 | 4.57 | 4.39 | 4.03 | 6.07 | 3.43 | 4.25 | -2.17 |
| SINGAPORE | ||||||||
| Current S$ (NSA) | 9.78 | 6.76 | 8.15 | 6.96 | 12.48 | 1.98 | 3.27 | -4.03 |
| Real 2001 S$ (NSA) | 10.66 | 8.17 | 7.21 | 6.35 | 8.72 | 2.93 | 4.04 | -2.28 |
More Economy in Brief

 Global| Feb 05 2026
Charts of the Week: Balanced Policy, Resilient Data and AI Narratives
by:Andrew Cates

