 Global| Feb 22 2010
Taiwan And Thailand Report Q4 09 GDP Growth
Summary
Taiwan and Thailand released fourth quarter Gross Domestic Product data this morning. Taiwan is a small highly industrialized island nation of about 7 million people with a per capita income of $16,428 in 2009 . Thailand, by contrast, [...]
 Taiwan
and
Thailand released fourth quarter Gross Domestic Product data this
morning. Taiwan is a small highly industrialized island
nation of about 7 million people with a per capita income of $16,428 in
2009 . Thailand, by contrast, is a large continental nation
of some 23 million people with a per capital income of $4,108 in
2008. Taiwan reported a fourth quarter increase of
4.23% and Thailand one of 3.6%.
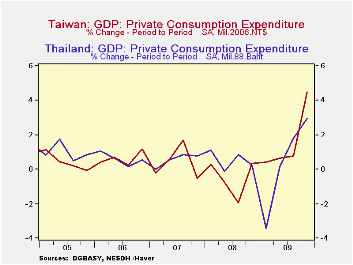
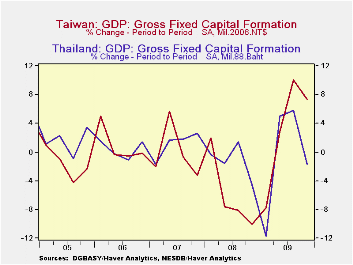
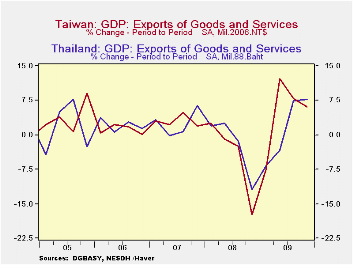
In Taiwan, although the rate of increase in the exports of good and service declined from 7.92% in the third quarter, it was still a respectable 6.08%. Private consumption, however, increased by 4.52% in the fourth quarter, compared with 0.77% in the third quarter. Fixed capital formation was up by 10.04% and inventory liquidation was sharply lower. Inventories have been cut back aggressively since the beginning of 2009. From declines 52,762, 29,881 and 75,142million 2006 NT$ in the third, second and first quarters of 2009 respectively, the fourth quarter saw a decline of only 2,555 million 2006 NT$.
In Thailand, exports of goods and service increased 7.69% in the fourth quarter, compared with 2.39% in the third quarter. Private consumption also accelerated, from 1.78% to 2.97%. Fixed investment, however, was 1.66% lower in the fourth quarter than in the third quarter and inventories were increased by 1,806 million '88 Bahts The inventory accumulation in the fourth quarter followed three previous quarters of liquidation. 17,367 mil 88 bahts in the third quarter, 910 in the second and 74,368 in the first quarter of 2009.
Quarterly changes in the major components of GDP for the two countries are shown in the accompanying charts and in the table below. Additional data for Taiwan and Thailand can be found in the Haver Data Base: EMERGEPR


| Q/Q Percent Changes (ex where noted) | Q4 09 |
Q3 09 |
Q2 09 |
Q1 09 |
Q4 08 |
Q3 08 |
Q2 08 |
Q1 08 |
|---|---|---|---|---|---|---|---|---|
| GDP: Taiwan | 4.23 | 2.45 | 4.25 | -2.55 | -3.62 | -3.62 | -0.33 | 1.26 |
| Thailand | 3.63 | 1.68 | 2.03 | -1.45 | -5.04 | -0.49 | -0.22 | 1.70 |
| Private Consumption: Taiwan | 4.52 | 0.77 | 0.65 | 0.39 | 0.38 | -1.192 | -0.78 | 0.30 |
| Thailand | 2.97 | 1.78 | 0.17 | -3.43 | 0.25 | 0.87 | -0.13 | 1.11 |
| Fixed Capital Formation: Taiwan | 10.07 | 7.68 | 22.38 | -30.52 | -10.46 | -2.31 | -8.93 | -7.20 |
| Thailand | -1.66 | 5.81 | 5.04 | -11.68 | -4.53 | 1.37 | -1.59 | -0.34 |
| Exports of Gds & Serv: Taiwan | 6.08 | 7.92 | 12.20 | -7.32 | -17.35 | -2.45 | -1.0 | 2.62 |
| Thailand | 7.69 | 2.39 | -3.40 | -6.66 | -11.90 | -1.33 | 2.52 | 1.96 |
| Chg in Inventories: Taiwan (Mil 2006NT$) | -2555 | -52762 | -29882 | -75142 | 37228 | 42424 | 25900 | 46269 |
| Thailand (mil 1988Bahts) | 1806 | -17367 | -910 | -74368 | 21240 | 30930 | -106 | 6497 |
More Economy in Brief
 Global| Feb 05 2026
Charts of the Week: Balanced Policy, Resilient Data and AI Narratives
by:Andrew Cates


