 Global| Feb 22 2021
Texas Manufacturing Activity Rose in February
Summary
• Production improves, employment moderates. • Prices received and prices paid measures both increased. • Expectations reading reaches highest since October 2018. Manufacturing activity in Texas improved in February, according to the [...]
• Production improves, employment moderates.
• Prices received and prices paid measures both increased.
• Expectations reading reaches highest since October 2018.
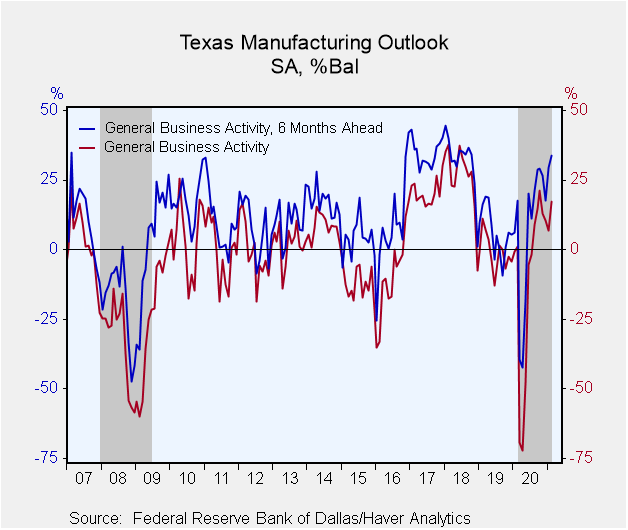
Manufacturing activity in Texas improved in February, according to the Texas Manufacturing Outlook Survey conducted by the Federal Reserve Bank of Dallas. The overall measure, the General Business Activity Index, expanded by 10.2 points to 17.2 in the February survey from 7.0 in January. Data were collected from 96 respondents between February 9 and 17.
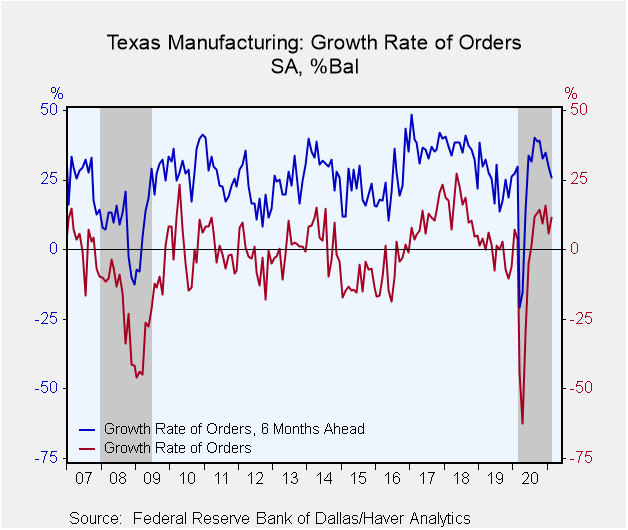
The production measure recovered from January’s low 4.6 to 19.9, but was still lower than December’s 26.8. The share of respondents reporting an increase in production increased from 27.3% to 36.3% while the share reporting a decreased indeed decreased from 22.7% to 16.4%. The overall index is the balance of the share of increases less decreases, thus 19.9. The net balance of the new orders growth measure improved to 11.6 from 5.9. The shipments reading moved moderately upward to 16.1 from 13.5, while the unfilled orders measure rose to 12.4% from 5.7%, and was its highest since 14.3% in July 2018.
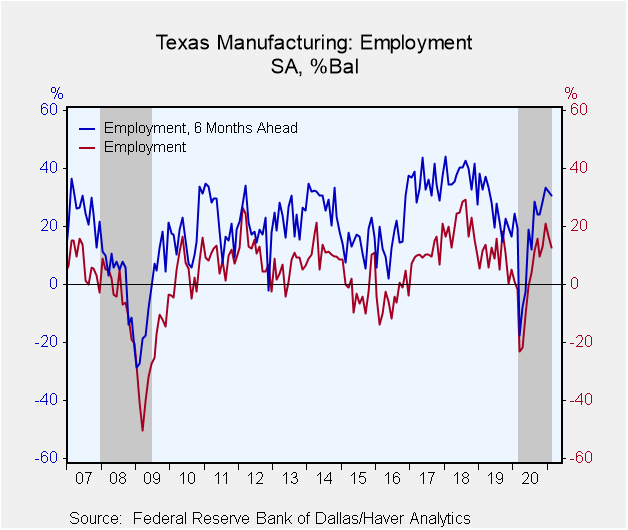
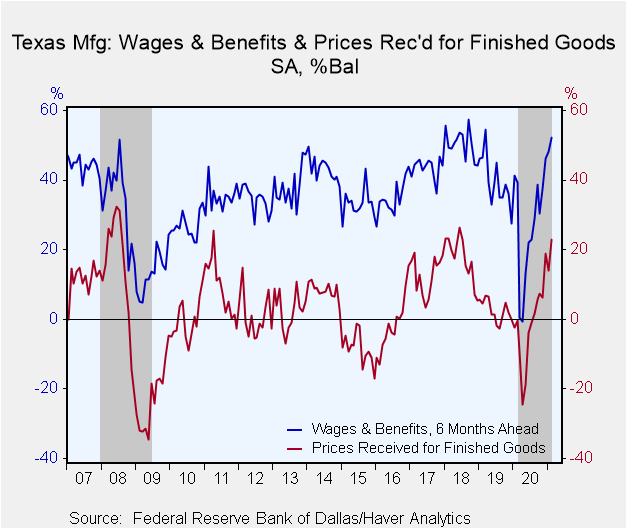
Employment did continue to soften, moving down to 12.7% this month from 16.6% in January and was its lowest since 9.8% in October 2020. This decrease in the net balance reflected decreases in both the number of respondents with larger employment and small employment. The reading on wages and benefits eased again, to 16.6% from 17.6% in January.
The measure of prices received for finished goods rose markedly to 23.0% this month from 13.9% in January. The February increase reflected a larger 25.5% share of respondents reporting price increases, up from 20.4% in January, while the share receiving lower prices decreased to 2.5% from 6.5%. Prices paid for raw materials picked up to 57.4 this month from 55.0 in January.
The headline index of expectations for overall business activity six months from now picked up to 33.9 from 29.6 and very close to its October 2018 high of 34.1. Most of the subindexes deteriorated, however, including production, new orders growth and employment. Nevertheless, expectations for wages & benefits improved to the highest level since March 2019.
Each index is calculated by subtracting the percentage reporting a decrease from the percentage reporting an increase. When all firms report rising activity, an index will register 100. An index will register -100 when all firms report a decrease. An index will be zero when the number of firms reporting an increase or a decrease is equal. Data for the Texas Manufacturing Outlook can be found in Haver's SURVEYS database.
| Texas Manufacturing Outlook Survey (SA, % Balance) | Feb | Jan | Dec | Feb '20 | 2020 | 2019 | 2018 |
|---|---|---|---|---|---|---|---|
| Current General Business Activity Index | 17.2 | 7.0 | 10.5 | 1.1 | -10.6 | -1.2 | 25.8 |
| Production | 19.9 | 4.6 | 26.8 | 16.8 | 3.7 | 8.9 | 21.4 |
| Growth Rate of New Orders | 11.6 | 5.9 | 15.9 | 3.8 | -5.3 | -1.1 | 14.8 |
| Employment | 12.7 | 16.6 | 20.9 | -1.9 | 1.6 | 9.5 | 20.0 |
| Wages & Benefits | 16.1 | 17.6 | 19.6 | 22.0 | 11.5 | 23.5 | 29.7 |
| Prices Received for Finished Goods | 23.0 | 13.9 | 19.0 | -0.3 | -1.7 | 2.5 | 17.6 |
| General Business Activity Index Expected in Six Months | 33.9 | 29.6 | 17.8 | 17.6 | 6.6 | 6.4 | 31.6 |
| Production | 40.2 | 43.7 | 47.3 | 34.6 | 31.3 | 35.6 | 48.6 |
| Growth Rate of New Orders | 25.8 | 29.8 | 34.9 | 29.9 | 23.9 | 25.2 | 35.8 |
| Employment | 30.8 | 31.9 | 33.4 | 19.4 | 15.5 | 26.0 | 37.7 |
| Wages & Benefits | 52.1 | 48.3 | 46.2 | 39.4 | 26.7 | 39.7 | 50.4 |
Carol Stone, CBE
AuthorMore in Author Profile »Carol Stone, CBE came to Haver Analytics in 2003 following more than 35 years as a financial market economist at major Wall Street financial institutions, most especially Merrill Lynch and Nomura Securities. She had broad experience in analysis and forecasting of flow-of-funds accounts, the federal budget and Federal Reserve operations. At Nomura Securities, among other duties, she developed various indicator forecasting tools and edited a daily global publication produced in London and New York for readers in Tokyo. At Haver Analytics, Carol was a member of the Research Department, aiding database managers with research and documentation efforts, as well as posting commentary on select economic reports. In addition, she conducted Ways-of-the-World, a blog on economic issues for an Episcopal-Church-affiliated website, The Geranium Farm. During her career, Carol served as an officer of the Money Marketeers and the Downtown Economists Club. She had a PhD from NYU's Stern School of Business. She lived in Brooklyn, New York, and had a weekend home on Long Island.
More Economy in Brief
 Global| Feb 05 2026
Charts of the Week: Balanced Policy, Resilient Data and AI Narratives
by:Andrew Cates


