 Global| Nov 23 2009
Thailand Adds To The Asian Recovery
Summary
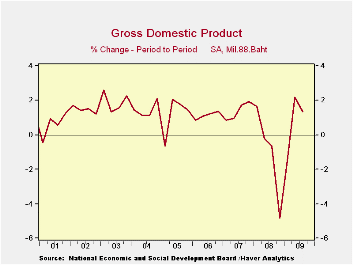
Thailand continues to recover from recession. On a quarter to quarter basis the third quarter Real Gross Domestic Product rose 1.35% compared with 2.27% in the second quarter, as shown in the first chart. The smaller increase in the [...]
 Thailand
continues to recover from recession. On a quarter to quarter basis the
third quarter Real Gross Domestic Product rose 1.35% compared
with 2.27% in the second quarter, as shown in the first
chart. The smaller increase in the third quarter was due in
part to a much greater increase in imports than in exports and an
increase in the pace of inventory liquidation. While exports
increased by 46 billion baht from the second to the third quarter,
imports rose by 48 billion bahts, reducing the favorable balance on
trade in goods and service by 2 billion bahts. The 17 billion
baht decline in inventories in the third quarter was almost double the
9 billion baht decline in the second quarter.
 The
other components of GDP showed gains: Private Consumption was
up 1.7%, Government Consumption, 0.9% and Gross Fixed investment,
5.8%. The statistical discrepancy was up almost 25%, but
because of its small size, it has little impact on the rate of
growth.
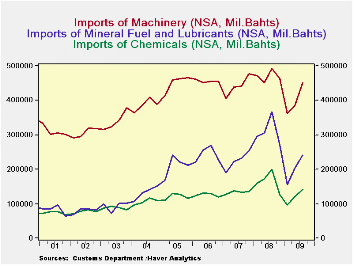
An increase in imports is frequently seen as the beginning of a recovery or expansion of activity in most economies and particularly in emerging economies. They need more raw materials and machinery than they produce domestically to meet growing domestic and foreign demands. The second chart shows Thailand's imports of Mineral Fuels and Lubricants, Chemicals and Machinery as an illustration of this type of import.
Both sets of data are found in Haver's EMERGEPR database.
| THAILAND | Q3 09 | Q2 09 | Q/Q Change | Q/Q % |
|---|---|---|---|---|
| GDP (BIL BAHTS) | 1067.5 | 1053.3 | 14.2 | 1.35 |
| Private Consumption | 562.6 | 553.0 | 9.6 | 1.74 |
| Government Consumption | 105.6 | 104.7 | 1.0 | 0.94 |
| Gross Fixed Capital Formation | 228.7 | 216.1 | 12.6 | 5.81 |
| Change in Inventory | -17.4 | -9.2 | -8.2 | - |
| Net Exports of Goods and Services | 180.4 | 182.7 | -2.2 | - |
| Exports | 691.9 | 645.9 | 46.0. | 4.12 |
| Imports | 511.5 | 463.2 | 48.2 | - |
| Statistical Discrepancy | 7.5 | 6.0 | 1.5 | 24.78 |
More Economy in Brief
 Global| Feb 05 2026
Charts of the Week: Balanced Policy, Resilient Data and AI Narratives
by:Andrew Cates


