 Global| Jun 18 2012
The Belgium Consumer
Summary
While Greek and Egyptian election news takes center stage these days, it is important not to lose sight of the wealth of economic data released each day. Among today's releases are data on Belgium's consumer confidence and [...]
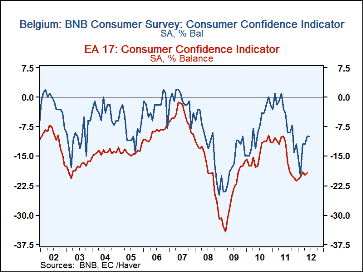
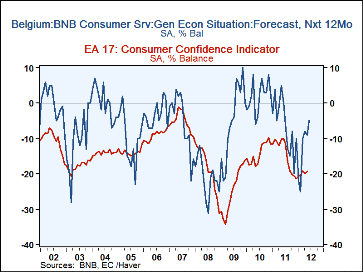
While Greek and Egyptian election news takes center stage these days, it is important not to lose sight of the wealth of economic data released each day. Among today's releases are data on Belgium's consumer confidence and expectations. The Belgian consumer is one of the earliest to report confidence and expectations. There was no change in the measure of Belgian consumers' confidence in June. Pessimists outnumbered optimists by 10% in both May and June. Expectations, however , improved a bit. The excess of pessimists declined from 9% in May to 5% in June.
Although generally pessimistic, like the rest of the Euro Area consumers, those in Belgium have been slightly less pessimistic than the average Euro Area consumer, as can be seen in the attached charts showing confidence and expectations for Belgium and for the Euro Area as a whole. Data on the balance of opinion on consumer confidence and expectations have been available since January, 1985. Over that time period, the average balance of opinion on confidence in the euro area was -12.0%. The average balance of opinion on expectations was -12.4%. In Belgium, the comparable figures were -7% and -9%.
| Jun'12 | May'12 | Apr'12 | Mar'12 | Feb'12 | Jan'12 | |
|---|---|---|---|---|---|---|
| Consumer Confidence (% Balance) | ||||||
| Belgium | -10 | -10 | -12 | -12 | -20 | -16 |
| Euro Area | -19.3 | -19.6 | -19.1 | -20.3 | -20.7 | |
| Consumer Expectations (% Balance) | ||||||
| Belgium | -5 | -9 | -8 | -10 | -25 | -22 |
| Euro Area | -23.7 | -24.0 | -21.0. | -24.2 | -27.4 | |
More Economy in Brief
 Global| Feb 05 2026
Charts of the Week: Balanced Policy, Resilient Data and AI Narratives
by:Andrew Cates


