 Global| Jul 12 2011
The Debt Crisis in the Euro-Area and Haver Data
Summary
The debt crisis in the Euro Area widened yesterday. While interest rates in the smaller troubled spots, Greece, Portugal and Ireland, which were already very high, rose slightly, interest rates in Italy and Spain spiked. Italy is the [...]
The debt crisis in the Euro Area widened yesterday. While interest rates in the smaller troubled spots, Greece, Portugal and Ireland, which were already very high, rose slightly, interest rates in Italy and Spain spiked. Italy is the third largest economy in the area with a nominal GDP of 1,547.6 million Euros in 2010. Spain is the fourth largest with a 2010 GDP of 1,062.6 million euros. Both countries far outweigh the other trouble countries in terms of economic importance. In 2010, nominal GDP in Greece was 230.3 million euros, in Portugal, 176.7 million euros and in Ireland, 156.0 million euros.
The Haver Data Base, INTDAILY, contains much useful data for monitoring the crisis. Daily values of interest rates, stock market prices, exchange rates are some of the data to be found there. Other data, such as daily yield spreads, can be computed using the material in INTDAILY. To illustrate, we have appended four charts.
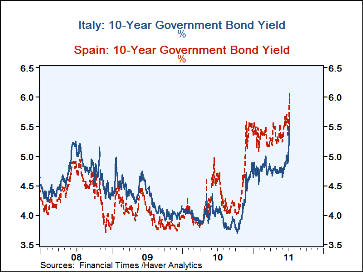
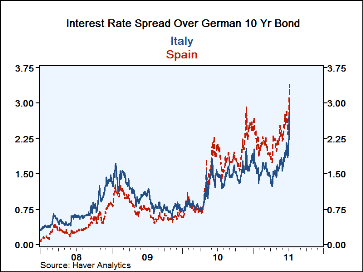
A debt crisis leads to rising interest rates. The first chart shows the yields on the 10 year government bonds of Italy and Spain. Yesterday, the yield in Italy rose 45 basis points to reach 5.72%, the highest rate in the last 11+ years. In Spain, the rate rose 38 basis points to 6.06%, and again a new high. The second chart shows the interest rate spreads between the 10 year government bonds of Italy and Spain and that of Germany. The German yield on its 10 year Government bond declined 16 basis points yesterday to 2.67%. The resulting spreads as of July 11 are 3.05 basis points for Italy and 3.39 for Spain, again new highs. These data are found in 10 Year Government Bond Yields, Financial Times, in the Interest Rate section of INTDAILY.
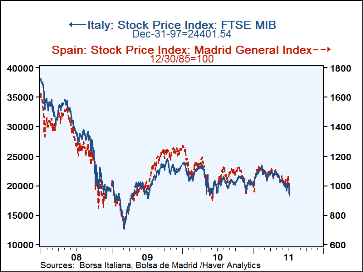
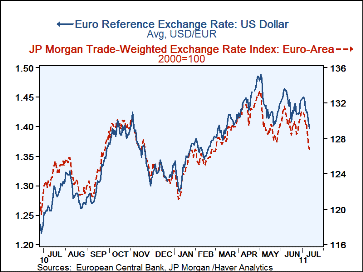
Debt crises are generally reflected in the stock markets. After two days of declines of almost 4%., the stock market is Italy rose 1.2% today, but the stock market in Spain continue to fall. It was down 0.5% today after two days of almost 3% declines.. The third chart shows the daily prices of stocks in Italy and Spain. Debt crises, also may weaken the currency. From time to time the debt problems in the Euro Area have tended to weaken the euro, but the impact has not been lasting. With widening of the problem into the larger economies, there may be a more lasting impact on the euro. In the fourth chart we show the spot exchange rate of the dollar vs. the euro and the JP Morgan Nominal Narrow Exchange Rate. Both show almost steady daily declines in the euro so far in July.
| Jul'12 | Jul'11 | Jul'8 | Jul'7 | Jul'6 | Jul'5 | Jul'4 | Jul'1 | |
|---|---|---|---|---|---|---|---|---|
| 10 Yr Gov Bond Yield (%) | ||||||||
| Italy | n.a. | 5.72 | 5.27 | 5.27 | 5.14 | 5.00 | 4.92 | 4.87 |
| Spain | n.a. | 6.06 | 5.68 | 5.62 | 5.62 | 5.49 | 5.10 | 5.36 |
| Greece | n.a. | 17.25 | 16.98 | 17.13 | 16.64 | 16.45 | 16.29 | 16.26 |
| Portugal | n.a. | 13.33 | 13.08 | 13.18 | 13.07 | 11.03 | 11.28 | 11.26 |
| Ireland | n.a. | 13.62 | 13.13 | 12.79 | 12.66 | 11.81 | 11.79 | 11.66 |
| Germany | n.a. | 2.67 | 2.86 | 2.97 | 2.94 | 2.98 | 3.01 | 3.02 |
| Yield Spread vs. Germany(BP) | ||||||||
| Italy | n.a. | 3.05 | 2.40 | 2.25 | 2.20 | 2.02 | 19.1 | 18.6 |
| Spain | n.a. | 3.39 | 2.88 | 2.65 | 2.68 | 2.48 | 2.39 | 2.34 |
| Stock Markets | ||||||||
| Italy (12/31/97=24401.54)) | 18510 | 18245 | 19050 | 19736 | 19483 | 20278 | 20476 | 20517 |
| Spain (12/30/85=100)) | 973 | 978 | 1006 | 1033 | 1034 | 1048 | 1069 | 1064 |
| Exchange Rates | ||||||||
| Dollar/Euro | 1.3975 | 1.4056 | 1.4242 | 1.4247 | 1.4318 | 1.4461 | 1.450 | 1.4488 |
| JPMorgan Nominal Narrow (2000=100) | 126.8 | 127.1 | 128.8 | 129.8 | 129.6 | 130.6 | 130.8 | 131.0 |


