 Global| Aug 26 2011
The Extraordinary Behavior of the U.S. Housing Sector
Summary
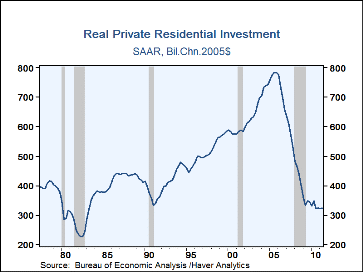
It's easy to get exasperated these days with the stubborn sluggishness in the U.S. economy. GDP data reported this morning highlight one continuing cause, the dramatic correction in the homebuilding sector. Other recent reports [...]
 It's easy to get exasperated these days with the stubborn sluggishness in the
U.S. economy. GDP data reported this morning highlight one continuing
cause, the dramatic correction in the homebuilding sector. Other recent
reports including housing starts and both new and existing home sales indicate
that the pattern is likely to continue. Not that we want to pile more onto
this heap, but updates for two other datasets published this past week highlight
the historic nature of the adjustment going on here.
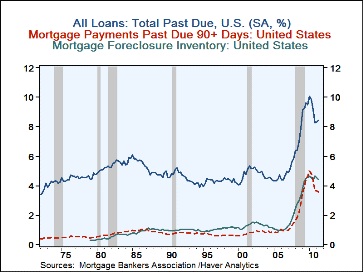
Monday, the Mortgage Bankers Association published the quarterly survey of its member institutions' delinquency and foreclosure trends for Q2. The latest data show that 8.44% of all mortgages have payments past due. This figure has been steady since last fall, arresting an all-too-brief improvement that had begun early in 2010, when the portion with late payments pierced 10% of all mortgages being serviced by these firms. The historical range for this late-payment measure is 4% - 5%. Mortgages badly past due, that is with payments more than 90 days in arrears, were 3.61% in Q2, also tracing a flat trend since last autumn following a partial improvement from an early 2010 peak. The historic level of this gauge of severely late payments is 0.5% - 1.0%. One doesn't know, since we've never been at these levels of these measures before, if these conditions have to improve much further for consumer demand to be re-energized or if such an improvement might be helped through widely touted government policies to try to spur job creation.
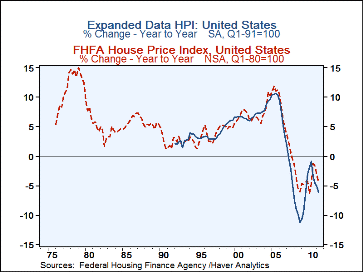
House prices are also intertwined with this. On Wednesday this week, the Federal Housing Finance Agency, FHFA, released its latest data on home prices. Encouragingly, the basic "purchase-only" index increased 0.9% in June from May, following 0.4% in May and 0.3% in April. The June amount is the largest monthly price increase since September 2005. However, it still leaves the index down 5.6% from a year ago and the resulting Q2 average up a minuscule 0.09% from Q1.
In this release, the FHFA included a new index based on a more comprehensive sampling of purchase and financing transactions. They have consulted county registers of deeds and other sources to compile a series that now includes homes with non-conforming mortgages, i.e., jumbo loans, and purely cash transactions that don't involve a financial institution. This index, which is quarterly and called the "Expanded Data Home Price Index", was still declining in Q2, by 1.1% from Q1 and was down 6.1% from the year before.
One of the problems we heard about during the financial crisis was that many portfolio and security valuation models couldn't handle negative numbers. A quick look at any house price series will illustrate why it might never have occurred to developers of those to devise their equations and expressions to handle such a contingency. Another unanswered question in the current environment, then, is whether house prices have to recover or at least trend higher in order for consumer spending and the jobs market to also experience recovery. There is no precedent. And no quick policy formula.
The mortgage delinquency and foreclosure data are in Haver's MBAMTG database, which includes data for the 50 States, District of Columbia and Puerto Rico. The house price indexes are in USECON for the national total and in REGIONAL; the latter includes data for States and D.C. plus metro areas by state and the aggregate non-metro area of each state.
%Chng
Carol Stone, CBE
AuthorMore in Author Profile »Carol Stone, CBE came to Haver Analytics in 2003 following more than 35 years as a financial market economist at major Wall Street financial institutions, most especially Merrill Lynch and Nomura Securities. She had broad experience in analysis and forecasting of flow-of-funds accounts, the federal budget and Federal Reserve operations. At Nomura Securities, among other duties, she developed various indicator forecasting tools and edited a daily global publication produced in London and New York for readers in Tokyo. At Haver Analytics, Carol was a member of the Research Department, aiding database managers with research and documentation efforts, as well as posting commentary on select economic reports. In addition, she conducted Ways-of-the-World, a blog on economic issues for an Episcopal-Church-affiliated website, The Geranium Farm. During her career, Carol served as an officer of the Money Marketeers and the Downtown Economists Club. She had a PhD from NYU's Stern School of Business. She lived in Brooklyn, New York, and had a weekend home on Long Island.


