 Global| Nov 08 2010
The OECD'S Leading Composite Indicators
Summary
The OECD (Organization for Economic Co-operation and Development) published September leading composite indicators for its member countries and six non member transitions countries today. In the attached charts we show the indicators [...]
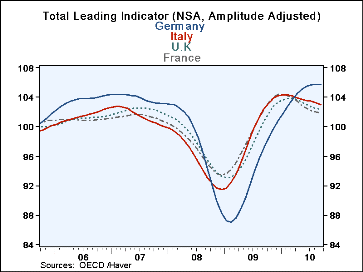
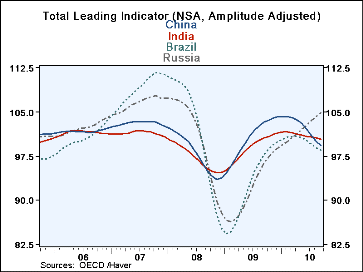
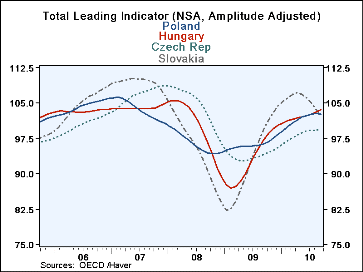
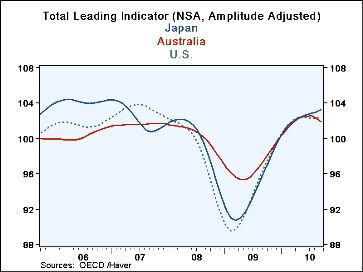
The OECD (Organization for Economic Co-operation and Development) published September leading composite indicators for its member countries and six non member transitions countries today. In the attached charts we show the indicators for some representative countries of (1) Western Europe, (2) Eastern Europe, (3) The BRIC Countries--Brazil, Russia, India and China and (4) the U. S., Japan and Australia.
The OECD system of composite leading indicators is designed to give early signals of turning points in economic activity. Among those countries continuing to show increases in their leading indicators in September are the U. S., Japan, Germany, Russia, Hungary and the Czech Republic. The continued rise in the leading indicators of these countries suggest that a turning point in their economic activity is not yet in the cards. They are likely to continue to experience expansion. Although the indicator for the Czech Republic is below its long term average of 100, it has been rising steadily, showing continued improvement.
Warning signs are up for those countries showing declines in their composite leading indicators--Italy, the U. K., France, Poland, Slovakia, China, India, Brazil and Australia. These are the countries to watch over the coming months to see whether they are headed for a slowdown or an actual downturn.
| OECD LEADING INDICATORS | ||||||||
|---|---|---|---|---|---|---|---|---|
| Sept 10 | Aug 10 | Jul 10 | Jun 10 | May 10 | Apr 10 | Mar 10 | Feb 10 | |
| Germany | 105.81 | 105.75 | 105.66 | 105.47 | 105.10 | 104.53 | 103.73 | 102.79 |
| Italy | 102.98 | 103.20 | 103.40 | 103.55 | 103.68 | 103.92 | 104.12 | 104.27 |
| U.K. | 102.37 | 102.47 | 102.66 | 102.96 | 103.31 | 103.61 | 103.78 | 103.79 |
| France | 101.86 | 101.95 | 102.13 | 102.45 | 102.89 | 103.41 | 103.88 | 104.24 |
| Poland | 102.67 | 102.76 | 102.68 | 102.40 | 102.00 | 101.48 | 100.84 | 100.06 |
| Hungary | 103.52 | 103.15 | 102.70 | 102.37 | 102.09 | 101.81 | 101.53 | 101.21 |
| Czech Republic | 99.41 | 99.35 | 99.27 | 99.08 | 98.70 | 98.18 | 97.59 | 96.97 |
| Slovakia | 102.41 | 103.57 | 105.08 | 106.07 | 106.85 | 107.16 | 106.92 | 106.17 |
| China | 99.26 | 100.01 | 100.93 | 102.04 | 103.01 | 103.64 | 104.02 | 104.20 |
| India | 100.33 | 100.55 | 100.72 | 100.88 | 101.05 | 101.25 | 101.42 | 101.56 |
| Brazil | 99.56 | 98.96 | 99.50 | 100.08 | 100.55 | 100.80 | 100.85 | 100.72 |
| Russia | 104.83 | 104.24 | 103.54 | 102.81 | 102.10 | 101.38 | 100.67 | 100.03 |
| Japan | 103.20 | 103.02 | 102.82 | 102.64 | 102.46 | 102.26 | 101.95 | 101.45 |
| Australia | 101.94 | 102.28 | 102.60 | 102.53 | 102.39 | 102.14 | 101.76 | 101.23 |
| U. S. | 102.41 | 102.28 | 102.25 | 102.33 | 102.42 | 102.35 | 102.05 | 101.51 |
More Economy in Brief
 Global| Feb 05 2026
Charts of the Week: Balanced Policy, Resilient Data and AI Narratives
by:Andrew Cates


