 Global| Apr 21 2021
The Power of Surprises
by:Andrew Cates
|in:Economy in Brief
Summary
Macroeconomists, market strategists and journalists spend countless hours seeking to "explain" the behaviour of financial markets. Movements in asset prices are typically 'rationalised' with reference to macroeconomic phenomena, [...]
Macroeconomists, market strategists and journalists spend countless hours seeking to "explain" the behaviour of financial markets. Movements in asset prices are typically 'rationalised' with reference to macroeconomic phenomena, geopolitical reverberations or policy considerations. The truth is usually far more nuanced, however, with sentiment, flows and positioning often more important drivers at least for day-to-day gyrations.
As a macroeconomist, however, it is still tempting to analyse these gyrations with reference to the 'big picture.' And the past few years have demonstrated that there are a few indicators that do a fair job at explaining what's going on.
Surprise, surpriseOne of the best indicators are data surprise indices. These capture the proclivity of incoming high frequency economic data (e.g. PMI surveys, retail sales, industrial production etc.) to surprise financial market economists' consensus forecasts. A rising trend suggests a persistent tendency from incoming data to surprise forecasters on the upside. And vice versa.
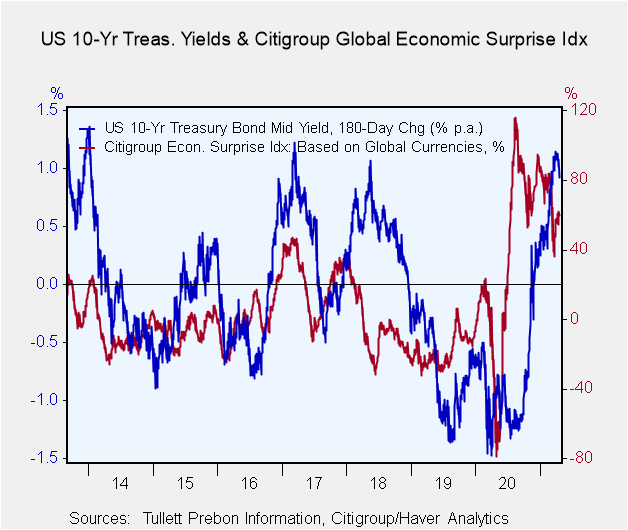
Tempting as it may have been then to 'rationalise' the recent run-up in US Treasury yields with reference to, say, US monetary policy considerations, easier fiscal policy, higher oil prices or COVID specifics, the message from figure 1 below suggest that positive data surprises may have been the more important driver. Of course some of those other factors – and for example looser policy settings – could have been responsible for the recent swathe of positive data surprises (as we discuss below). But since there ought to be a lag between the easing of policy and the impact on economic data (e.g. from lower taxes to higher consumer spending) pinpointing the precise channel of influence on data surprises is tricky.
In truth the forecasting prowess of these data surprise indices is admittedly not strong. This data are more of a coincident indicator than a forward-looking indicator of financial market trends. There are occasions, however, when surprises lead markets as, for instance, appears to have been the case in the past 12 months. That data surprise indices have lost some positive momentum in recent weeks could therefore suggest less upside for US (and global) bond yields in the period immediately ahead.
Figure 1: US 10 year Treasury yields versus Citigroup Global Economic Surprise index
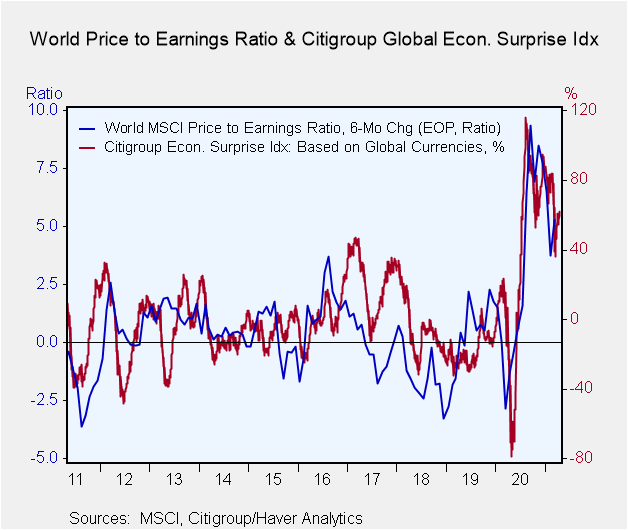
The power of data surprise indices, however, is further amplified if we bring other financial markets into the fold. For example, the Citigroup Global Economic Surprise index tracks 6 month changes in the price-to-earnings ratio on the global MSCI equity index quite closely, as evidenced in figure 2 below. This is helpful for those that, for example, may have been concerned about the degree to which higher yields – and thus a higher discount rate – may have reduced the relative attractiveness of equities relative to bonds in recent months. That there has been a common driver of valuation shifts – namely stronger than expected economic data – is perhaps less concerning for equity investors than if, for instance, firmer inflation expectations had accompanied weaker growth expectations.
Figure 2: World MSCI price to earnings ratio versus Citigroup Global Economic Surprise index
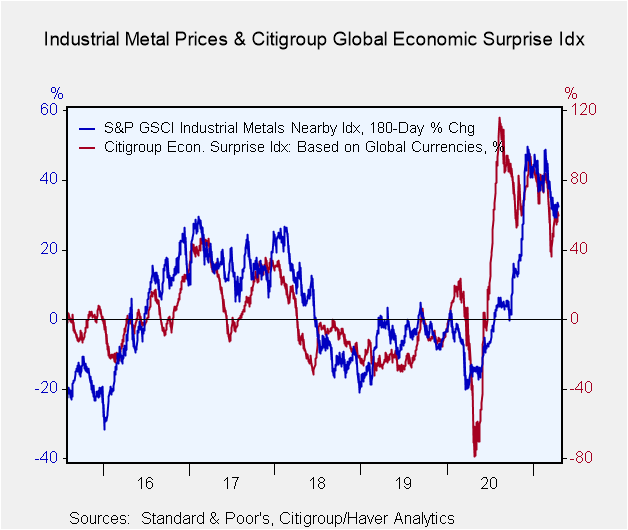
This common driver of financial market trends can also be seen in the commodity complex. The ebb and flow of industrial metal prices, for example, tend to closely mirror (and sometime echo) the ups and downs of data surprises (see figure 3 below).
Figure 3: Industrial metal prices versus Citigroup Global Economic Surprise index
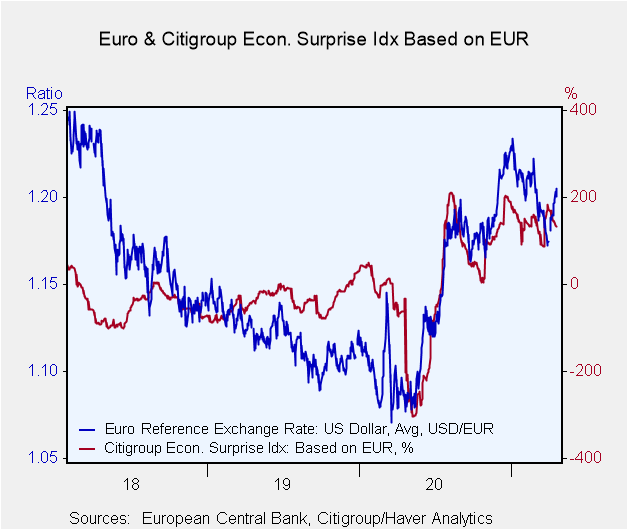
It's worth noting too that it's not just the global pattern of these surprises that appears to matter. If we drill into country or region specifics we find that in foreign exchange markets the surprise index for the Euro area has done a reasonable job in tracking the euro over the last several months.
Figure 4: The euro versus Citigroup Eurozone Surprise index
Money, money, money
All this begs the question as to what drives a data surprise index? This is obviously not easy. Consensus forecasts in theory ought to bring together all the information about an economic aggregate that is known and should represent an unbiased estimate of its likely outcome. In addition – and as discussed above – there are several potential candidates that might be helpful (e.g. policy settings). But pinpointing their influence at any given point in time is hard. That being said there are a couple of variables that appear to be helpful in foreshadowing or, at the very least, tracking the broad upswings and downswings in these surprise indicators.
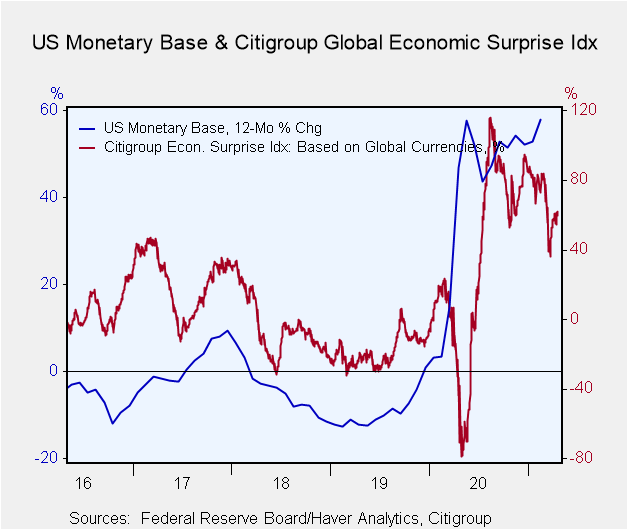
The first of these is narrow money aggregates and more specifically US narrow money aggregates. As evidenced in figure 5 below the growth rate of the US monetary base, and particularly its heady expansion over the past 12 months, does a good job at foreshadowing the burst of positive global data surprises that has been unfolding. In other words easier US monetary policy and the heightened asset purchases that has accompanied this have arguably been of some significance. And that of course makes sense insofar as this expansion in the money supply has consequences for the US economy, for other asset prices and – via, for example, swings in the US dollar – for the world economy as well.
We suspect incidentally that US fiscal policy shenanigans have also been of some significance in generating shifts in data surprise indices given the degree to which policy settings have been loosened and the pace at which these indices have been climbing. Proving this empirically via chart is, however, very difficult.
Figure 5: US monetary base versus Citigroup Global Economic Surprise index
Uncertainty
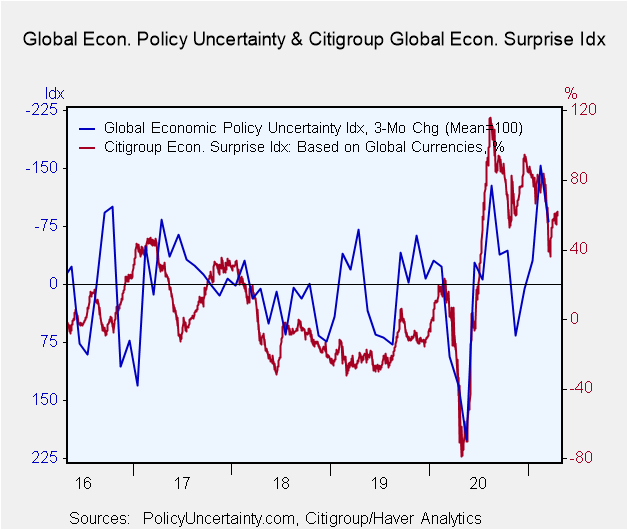
A final indicator though that's also potentially helpful is an index of uncertainty. Specifically the policy uncertainty indices that are available from www.policyuncertainty.com seem to do a reasonable – though admittedly not perfect – job in foreshadowing shifts in data surprises (see figure 6 below and note that the uncertainty index in that figure has been inverted). This is, in many respects, to be expected as uncertainty ought to impact things like consumer and business confidence. And the data flow for the latter is obviously featured in surprise indicators.
Figure 6: Global economic policy uncertainty versus Citigroup Global Economic Surprise index
No forecasts
What does this all mean for financial markets in the period ahead? Without wishing to stand on the fence we are not in the business of economic and financial forecasting and are not minded to offer a strong view. The key issues though that are of relevance from the discussion above do not, however, suggest great cause for alarm right now. Fed policy remains super loose which is supporting rapid growth in the monetary base. Uncertainty indices in the meantime have come off their highs. And they may well decline further if the news-flow on COVID turns more positive with vaccination success. However, without wishing to sound two handed, these positives need to be set against the fact that expectations for incoming economic data are liable now to be quite high. The hurdle over which the numbers need to cross in other words has been raised. It may come as no surprise in other words if the underlying buoyancy in asset markets (e.g. in equities and commodities) fades somewhat in the period immediately ahead.
Viewpoint commentaries are the opinions of the author and do not reflect the views of Haver Analytics.Andrew Cates
AuthorMore in Author Profile »Andy Cates joined Haver Analytics as a Senior Economist in 2020. Andy has more than 25 years of experience forecasting the global economic outlook and in assessing the implications for policy settings and financial markets. He has held various senior positions in London in a number of Investment Banks including as Head of Developed Markets Economics at Nomura and as Chief Eurozone Economist at RBS. These followed a spell of 21 years as Senior International Economist at UBS, 5 of which were spent in Singapore. Prior to his time in financial services Andy was a UK economist at HM Treasury in London holding positions in the domestic forecasting and macroeconomic modelling units. He has a BA in Economics from the University of York and an MSc in Economics and Econometrics from the University of Southampton.
More Economy in Brief
 Global| Feb 05 2026
Charts of the Week: Balanced Policy, Resilient Data and AI Narratives
by:Andrew Cates


