 Global| Nov 02 2020
The Second Wave Slowdown
by:Andrew Cates
|in:Economy in Brief
Summary
The global news-flow on COVID-19 has darkened in recent weeks and that will surely sour the economic outlook. A second wave is well and truly underway in many major economies (see figure 1) and policymakers have responded in some [...]
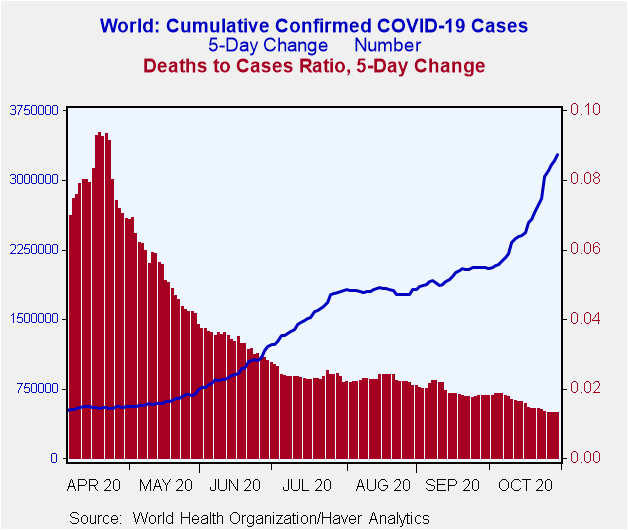
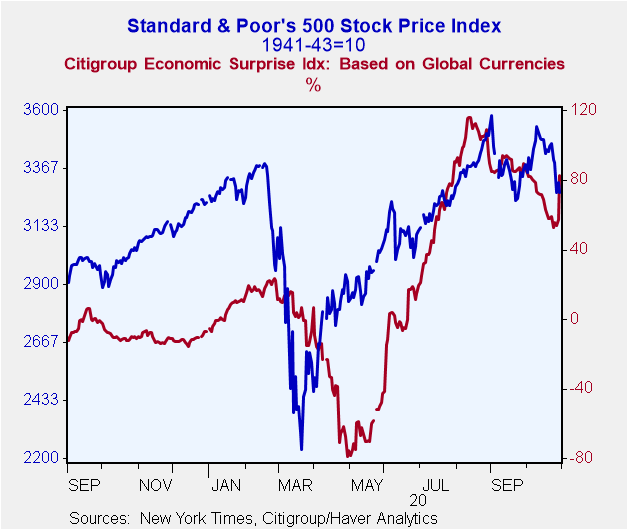
The global news-flow on COVID-19 has darkened in recent weeks and that will surely sour the economic outlook. A second wave is well and truly underway in many major economies (see figure 1) and policymakers have responded in some cases by instigating more stringent lockdown regimes. In addition to this as investors have begun to price in some inevitable further disruption for economic activity, financial markets have been more unsettled in the last few days (see figure 2).
Figure 1: Global case numbers versus global fatalities Figure 2: The US S&P 500 index versus economic data surprises
In what follows we look in more detail at some of the latest evidence on the world economy and on the virus. And we offer some perspective on how the second wave will likely impair mobility and economic activity. Our conclusions are as follows:
• Notwithstanding a relatively strong growth performance in Q3, output in most major economies is still well below pre-COVID levels. The exception to this is China and the reasons are straightforward - they concern the timing and intensity of COVID-19.
• COVID risk indicators, however, still place many of those same major economies and most notably the US, France, Spain, the Netherlands and the UK in high risk categories. While some of these countries have already tightened up their lockdown measures in recent days, the current mobility of their populations relative to COVID risks suggests that further measures could be needed in the coming weeks in order to choke off virus transmission.
• A simple analysis of the relationship in Q2 suggests that every 10%-point reduction in mobility cuts GDP growth by 1.4%-point. The relationship isn't as simple as that but even so, consensus growth forecasts for many countries in 2021 may now be too high and are at risk of downward revision. As a result policymakers need to take great care about withdrawing fiscal policy stimulus too soon. Monetary policy in the meantime seems apt to remain looser for longer in the period ahead.
In what follows we look in more detail at some of the factors driving those conclusions.
Impressive Q3 data in the US, Germany and France
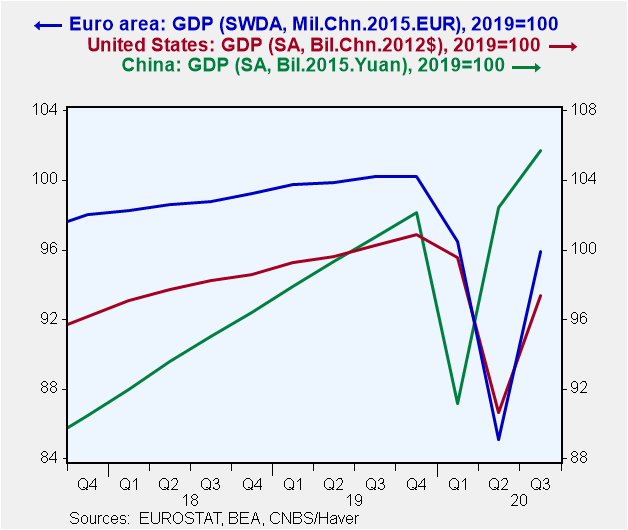
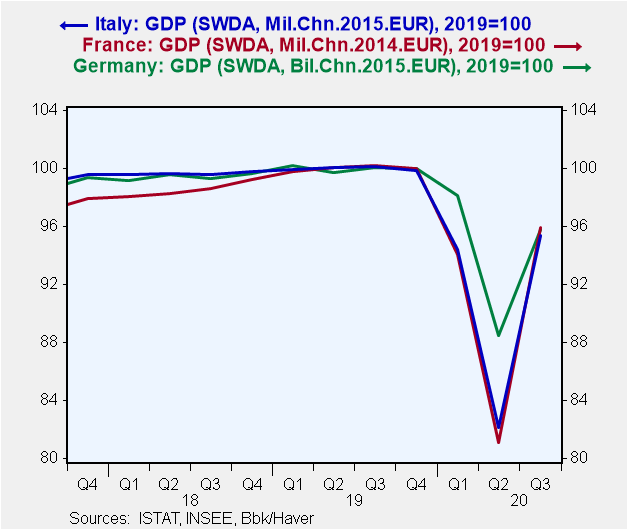
Let's start with some of the more positive news concerning economic growth. The GDP estimates for Q3 that were released late last week in the world's major economies mostly exceeded forecasters' expectations. France's GDP rose by 18.2% q/q, Italy's GDP rose by 16.1% q/q, Germany's GDP rose by 8.2% q/q, and US GDP by 7.4% q/q (on a non-annualised basis). These data contrast with China where GDP “only” managed to eke out a gain of 3.2% q/q in Q3, a little below consensus forecasts.
As ever with cross-country comparisons such as these some perspective is needed. China's more meagre growth performance in Q3 followed a far more impressive GDP gain of 12.4% in Q2. In contrast, those stronger-than-expected GDP figures from the US, Germany, Italy and France followed pretty dire data in Q2. The more instructive message from these data concerns figure 3 and figure 4 below which shows GDP levels re-based to 100 in 2019. It shows that Italy's economy was still some 4.6% smaller in Q3 2020 relative to its average level in 2019; France's economy was still some 4.1% smaller; Germany's economy was 2.8% smaller; and the US economy was 2.7% smaller. China's economy in contrast was some 5.7% larger in Q3 relative to 2019 as a whole.
Figure 3: GDP Levels in the Euro area, the US, and China Figure 4: GDP levels in Germany, France, and Italy
It's not that difficult to understand why China's economy is faring relatively well while the US and Europe are faring less well. The earlier outbreak of COVID-19 in China (relative to elsewhere), the policies that have been enacted both to choke off its transmission and fend off its economic consequences, and the absence so far of any second wave in China have all been crucial. The key question though is what happens now?
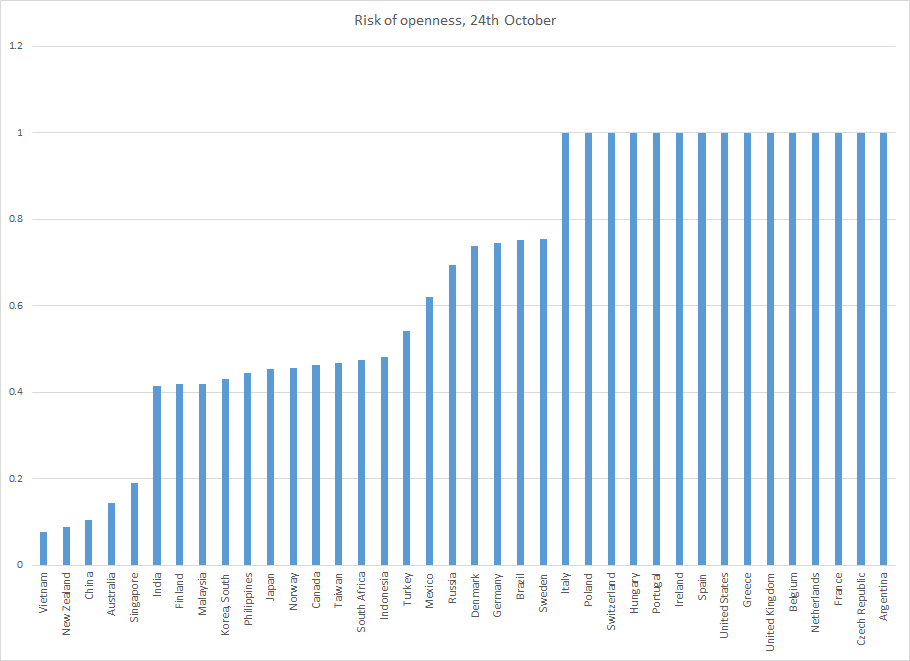
Current COVID risksTo broaden the perspective on our answer we include in our discussion below several other countries, both developed and developing. We look first at how these countries are faring with the virus based on the COVID risk of openness index that's compiled by Oxford University. This is a measure of risk that a country faces from adopting an ‘open' policy stance, that is: one that does not include policy measures to contain the virus through physical distancing measures. The index ranges from 0 to 1 with the higher the index the greater the risk of viral transmission absent offsetting policy responses.
Based on data to October 24th this index presently shows that a fairly large number of developed countries find themselves in a relatively precarious position (see figure 5). That list includes France, the UK, Spain, the US, and Italy and with Germany not that far behind. China, in contrast, is in a far less precarious position as indeed are several Asian (and Australasian) economies.
Figure 5: COVID risk of openness index for a selection of developed and developing countries
Source: University of Oxford, Haver Analytics
COVID risks and mobilitySo, if this index suggests that COVID transmission risks are high absent offsetting policy measures, then policy measures are very likely to be instigated that slow that transmission in the weeks ahead. Indeed several further major initiatives have already been announced in recent days in countries such as France, Germany and the UK that will restrain their population’s mobility.
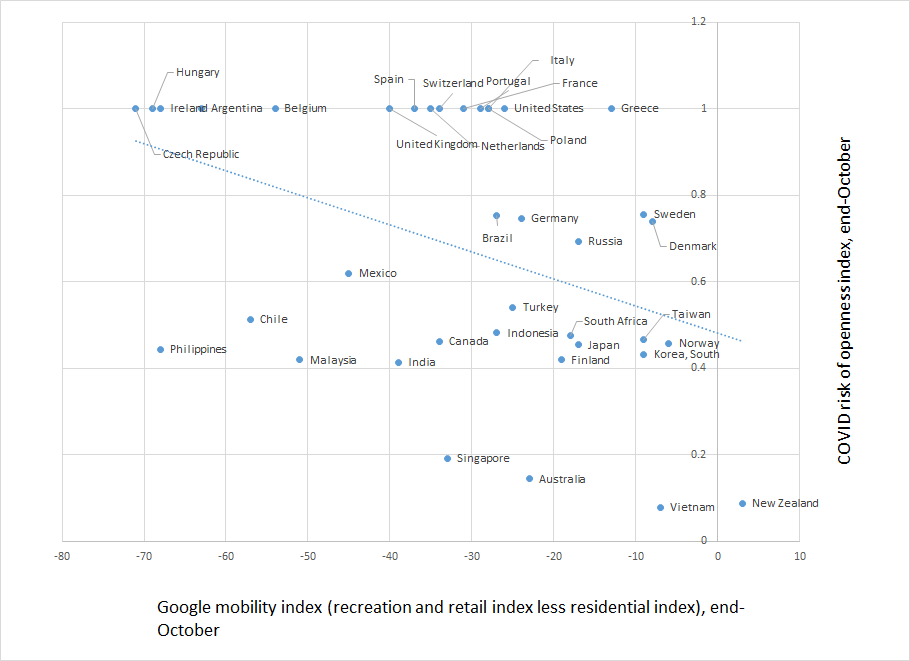
Are further offsetting initiatives likely to be necessary in other countries and even in France, the UK and Germany? To answer that question we looked below at current levels of various countries' COVID risks relative to current levels of their population's mobility. The latter is measured with reference to Google's mobility index for recreation and retail outlets minus the index for residential establishments. A less negative level of this gap ought to indicate greater mobility amongst the underlying population – e.g., a greater willingness to head out to the shops relative to staying at home.
We should stress here that there are several caveats to drawing strong conclusions from this simple analysis. Cross-country comparisons of Google's mobility data are difficult to make since mobility can be impacted by other factors, for example, seasonal weather patterns. What we can infer with reasonable confidence is that - at present - relatively low levels of mobility characterise countries such as Hungary, Ireland and the Czech Republic in the north-west corner of figure 6 below. Relatively high levels of mobility in contrast can be seen in New Zealand, Vietnam, and Australia in the south-east corner of that figure. Compared with these low-mobility and high-mobility countries, the likes of the UK, Spain, the Netherlands, Switzerland, France, and the United States among a few others – in the northern area of our figure - confront quite high levels of mobility RELATIVE to their COVID risks. That potentially suggests that further restrictive measures may be necessary to mitigate a further spread of the virus in some of these countries in the coming weeks. That some of these countries have recently announced new restrictions moreover is not surprising.
Figure 6: Mobility versus COVID risk
Source: National sources, Google, Haver Analytics
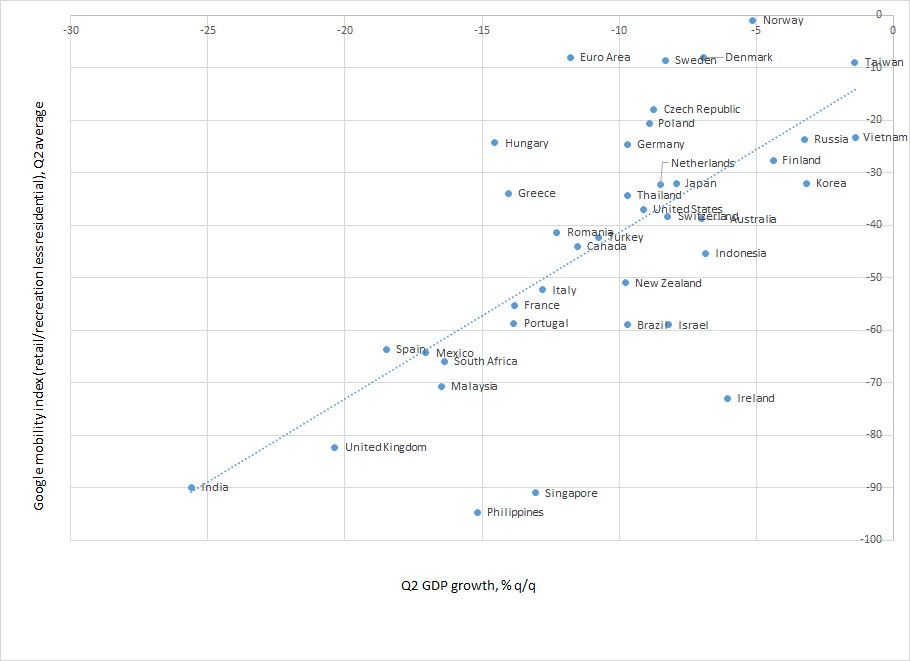
What would reduced levels of mobility imply though for economic activity? Based on the relationship between mobility and economic growth that was observed in Q2 2020 (see figure 7 below), we estimate via a simple regression that a 10 percentage point decline in mobility (measured again by the spread between Google's mobility index for recreation and retail minus the residential index) is associated with a 1.4 percentage point decline in GDP growth.
Of course there are many other factors that have affected – and will continue to – affect this relationship. Policy initiatives in particular that have been enacted to fend off financial instability and shore up economic growth are clearly of great importance but are not considered in this bivariate analysis.
Nevertheless the analysis still suggests that if policymakers now enact more stringent policies, and mobility is subsequently impaired, that economic growth in those countries concerned will now be much more subdued in the months ahead. Growth forecasts are liable to be downwardly revised in those countries. And echoing the IMF's conclusions on these matters, policymakers arguably ought to refrain from withdrawing fiscal policy support too quickly. Finally, monetary policy may need to be loosened further. Indeed there is a now growing expectation that the ECB and the BoE will instigate further loosening measures in the coming weeks either via expansions and/or extensions of their QE programmes, lower policy rates and/or more generous bank funding programmes.
Figure 7: Mobility versus growth
Source: National sources, Google, Haver Analytics
Viewpoint commentaries are the opinions of the author and do not reflect the views of Haver Analytics.Andrew Cates
AuthorMore in Author Profile »Andy Cates joined Haver Analytics as a Senior Economist in 2020. Andy has more than 25 years of experience forecasting the global economic outlook and in assessing the implications for policy settings and financial markets. He has held various senior positions in London in a number of Investment Banks including as Head of Developed Markets Economics at Nomura and as Chief Eurozone Economist at RBS. These followed a spell of 21 years as Senior International Economist at UBS, 5 of which were spent in Singapore. Prior to his time in financial services Andy was a UK economist at HM Treasury in London holding positions in the domestic forecasting and macroeconomic modelling units. He has a BA in Economics from the University of York and an MSc in Economics and Econometrics from the University of Southampton.
More Economy in Brief
 Global| Feb 05 2026
Charts of the Week: Balanced Policy, Resilient Data and AI Narratives
by:Andrew Cates


