 Global| Oct 12 2009
The U.S. Dollar and International Reserves
Summary
The 8% decline in the broad trade-weighted dollar since February of this year is having Central Bankers outside the United States rethink the currency composition of their international reserve holdings. A major reallocation of [...]
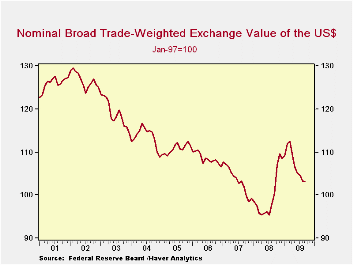
 The 8% decline in the broad trade-weighted dollar since
February of this year is having Central Bankers outside the United
States rethink the currency composition of their international reserve
holdings. A major reallocation of currencies could have serious
consequences for the U.S. Actually, this latest decline in the dollar
is from an unexpected high that resulted from the pursuits of safe
havens on the part of foreigners in the midst of the financial crisis.
As can be seen in the first chart, the long-term trend of the dollar on
a broad trade-weighted basis has been declining for the last seven or
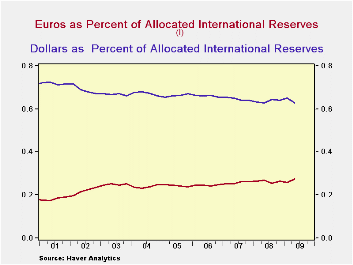
eight years. During this time, there has been a steady shift in the
composition of total international reserves from dollars to Euros, as
can be seen in the second chart. Dollars now account for 62.8% of the
reserves of the countries reporting currency composition, compared with
72.7% in the second quarter of 2001. Meanwhile the share of euros has
gone from 17.6% to 27.5%.
Data reported by the International Monetary Fund and found in
the Haver IFS Data Base can help in monitoring this
situation, particularly, Currency Composition of Official
Foreign Exchange Reserves, which is in dollars with a
quarterly frequency and Share of National
Currencies in Total Identified Official Holding of Foreign Economies, which
is in SDRs with an annual frequency. Reserves are also found in the
individual country source data.
After declining in the third and fourth quarters of 2008 and the first quarter of 2009, total international reserves increased by $312 billion in the second quarter of this year to reach $6.80 trillion. Indications are that the rise has continued. Data for the third quarter of this year are not yet available for China, but data for some of the other large holders of reserves, namely, Japan, Russia, India, Taiwan and Korea are available and all have been increasing. Not all countries report the currency composition of their reserves. Unfortunately, among those not reporting is China, the holder of the largest reserves at $2.1 trillion. As a result, the amount of reserves for which the currency composition is known is much smaller--$4.3 trillion at the end of June 2009. It is this smaller universe that the data in the second chart are based.
| Q2 09 | Q1 09 | Q4 08 | Q3 08 | Q2 08 | |
|---|---|---|---|---|---|
| Total Foreign Exchange Reserves ( Billion $) | 6801.0 | 6489.4 | 6645.1 | 6846.6 | 6901.0 |
| Total Allocated | 4269.6 | 4057.9 | 4210.7 | 4360.6 | 438.2 |
| Emerging and Developing Countries Total | 4236.3 | 4076.3 | 4194.1 | 4440.6 | 4491.2 |
| Allocated | 2024.5 | 1946.7 | 2053.1 | 2238.1 | 2254.2 |


