 Global| Nov 17 2003
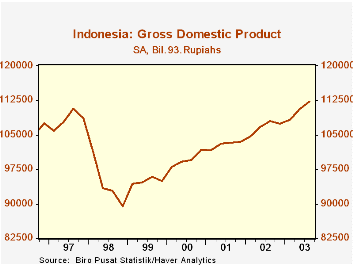
Third Quarter Indonesian GDP Exceeds pre 1988 Crisis Levels
Summary
Gross domestic product in Indonesia rose 0.91% in the third quarter. It has generally been on a rising trend since the trough reached in the 1988 Asian crisis. At 112.304.4 Billions Rupiahs, it is now slightly above the peak rate [...]

Gross domestic product in Indonesia rose 0.91% in the third quarter. It has generally been on a rising trend since the trough reached in the 1988 Asian crisis. At 112.304.4 Billions Rupiahs, it is now slightly above the peak rate reached in the third quarter of 1997 before the crisis.
Over the period from the third quarter of 1987 to the third quarter of 2003, the composition of output has changed significantly. Private consumption has risen almost 15% and government consumption, almost 30%. Exports of goods and services have declined about 3% over the period, but imports have declined by 28% so that a deficit in the balance of 2,991.2 Billions Rupiah in the third quarter of 1987 has become a surplus of 5,675.5 Billions Rupiah in the third quarter of 2003. Gross capital formation has yet to recover. The latest figure is almost one-half of that reached in the pre crisis period.
| Q3 2003 % |
Q2 2003 % |
Q1 2003 % |
Q3 2003 Bil 93 Rupiahs |
Q3 1987 Bil 93 Rupiahs |
% Change | |
|---|---|---|---|---|---|---|
| Total | 1.48 | 2.13 | 0.91 | 112,304.4 | 110,804.1 | 1.4 |
| Private consumption | 1.33 | 0.90 | 0.78 | 79,260.2 | 68,972.2 | 14.9 |
| Government consumption | 8.29 | 9.44 | -12.06 | 10,113.0 | 7,967.6 | 26.9 |
| Gross capital formation | 0.16 | -1.93 | -1.21 | 17,255.7 | 36,855.5 | -53.2 |
| Exports of goods and services | 3.78 | -3.17 | 1.81 | 29,832.5 | 30709.9 | -2.9 |
| Imports of goods and services | 5.64 | -8.33 | 4.73 | 24,157.0 | 33701.1 | -28.3 |


