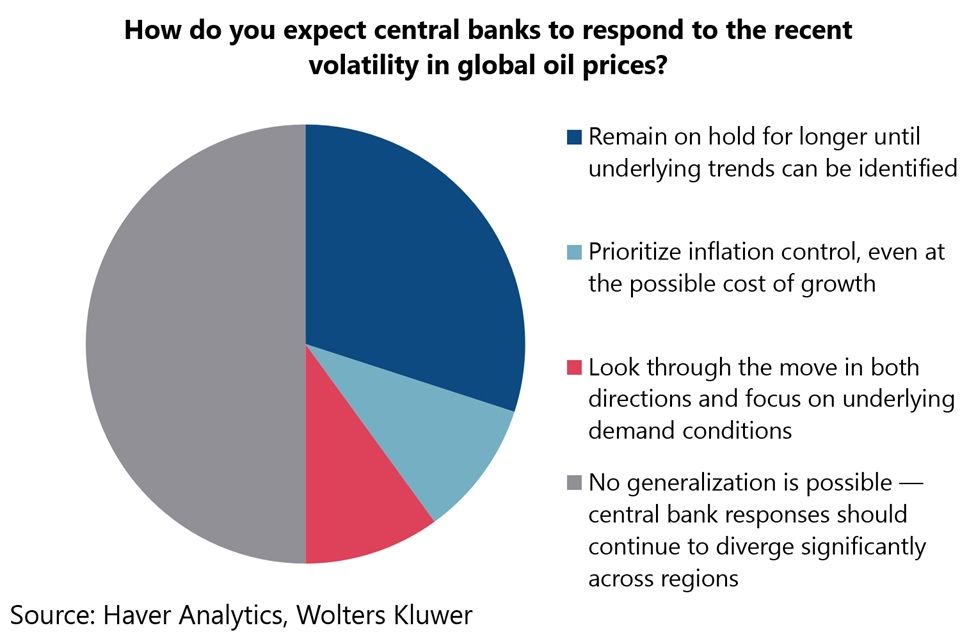
Haver Analytics
Haver Analytics

Introducing

Tian Yong Woon

Tian Yong joined Haver Analytics as an Economist in 2023. Previously, Tian Yong worked as an Economist with Deutsche Bank, covering Emerging Asian economies while also writing on thematic issues within the broader Asia region. Prior to his work with Deutsche Bank, he worked as an Economic Analyst with the International Monetary Fund, where he contributed to Article IV consultations with Singapore and Malaysia, and to the regular surveillance of financial stability issues in the Asia Pacific region.

Tian Yong holds a Master of Science in Quantitative Finance from the Singapore Management University, and a Bachelor of Science in Banking and Finance from the University of London.

Publications by Tian Yong Woon

  • This week, we explore the growing impact of recent US policy moves—particularly President Trump’s “reciprocal” tariffs scheduled for April 2—with a spotlight on their implications for Asia. The effects of China’s retaliation to the US’s first round of 10% tariffs are already visible in the data (Chart 1). Similarly, in South Korea, the Biden administration’s tightening of chip export restrictions has likely contributed to a slump in the economy’s recent semiconductor exports to China (Chart 2). Despite these challenges, investor concerns about Trump’s upcoming "reciprocal" tariffs have been eased by reports suggesting they may not be a blanket measure, with certain economies potentially exempt. While the potential impact of these tariffs on Asia may initially seem significant, the effects are likely to be concentrated in a few economies, particularly India. This is mainly because, India still maintains one of the highest average tariff rates in the world (charts 3 and 4), despite progress in reducing tariffs over the years (Chart 5). In contrast, South Korea, though it has a relatively high average tariff rate, benefits from a very low effective tariff rate on US imports (Chart 6), thanks to its bilateral trade agreement with the US.

    Tariff effects on China Earlier, China responded to the US’s first round of 10% tariffs on Chinese imports by placing tariffs on certain energy products and large-engine cars from the US. The effects of these tariffs are already evident in the data, as shown in chart 1. Specifically, China’s imports of US cars have continued to decline sharply, and its imports of certain energy-related products have also decreased through the year so far. However, China’s overall imports from the US have increased on a year-over-year basis. Looking ahead, investors are likely focused on the impact of China’s second round of retaliatory tariffs, which mainly target US agricultural goods.

  • This week, our focus turns to Japan as the Bank of Japan (BoJ) prepares for its key policy decision on Wednesday. While the BoJ has made meaningful progress toward monetary policy normalization, it remains an outlier among major central banks, many of which have already begun easing after previous tightening cycles (chart 1). The rationale for Japan’s shift is clear—after decades of chronic price stagnation during the so-called Lost Decades, the country has finally experienced sustained inflation, warranting a gradual recalibration of monetary policy (chart 2). That said, Japan’s inflation story is not without challenges. A rice shortage has driven prices sharply higher, underscoring supply-side pressures in an economy that remains vulnerable to commodity price fluctuations (chart 3). Meanwhile, wage growth is also picking up, with annual wage negotiations delivering encouraging preliminary results—this spring, it’s not just cherry blossoms that are in full bloom (chart 4). These developments have been reflected in rising Japanese government bond yields and a notable recovery in the yen against the US dollar (chart 5). However, part of this yen strength may also be linked to Japan’s recent divestment of US Treasuries, as the country has significantly reduced its holdings over the past year (chart 6). As the BoJ navigates its policy shift, the coming months will be crucial in determining whether Japan can sustain its inflation momentum without sacrificing economic stability.

    Japan monetary policy The Bank of Japan (BoJ) initiated a major shift last year, gradually moving away from its eight-year-long negative interest rate policy, signalling a transition from its ultra-loose monetary stance. Since then, the BoJ has raised interest rates three times, citing positive developments in inflation and wage growth—topics we will explore in more detail shortly. However, as shown in chart 1, the BoJ remains far behind its peers in the policy cycle. Major central banks like the US Federal Reserve, the Bank of England, and the European Central Bank have already completed their tightening cycles and are now easing, as inflation has become better-behaved. Moreover, Japan’s real policy rates remain deeply negative, with low policy rates persisting while inflation continues to rise. Despite this, investors do not anticipate another rate hike during this week’s BoJ monetary policy meeting, with the next tightening move expected sometime in Q3.

  • This week, we look again at US tariff policy and explore its potential implications for Asia, particularly China and South Korea. While US President Trump has temporarily dialled back his actions on Canada and Mexico, he has moved forward with doubling the tariff rate on China to 20%. However, China’s trade data have already started to exhibit more fragility (chart 1), and lingering uncertainties are also beginning to affect other trade-dependent economies, such as South Korea (chart 2). To make matters worse, South Korea is grappling with significant political uncertainty at home, with much-needed fiscal support still in limbo. This only adds to the policy uncertainty it faces (chart 3). We also take a closer look at the key messaging coming out of China’s National People’s Congress, which began last Wednesday. Notably, China reaffirmed its commitment to an annual growth target of "around 5%" (chart 4), supported in part by more expansionary fiscal policy (chart 5). Additionally, we examine China’s increased focus on shifting toward a more consumption-driven economy and the associated challenges (chart 6). This shift seems increasingly necessary, given the potential decline in export revenues due to more protectionist US policies.

    The US’ latest tariff actions Last week, US President Trump proceeded with the implementation of blanket 25% tariffs on Canada and Mexico, following a prior delay. Additionally, he doubled import tariffs on China, increasing them from 10% to 20%. However, he later provided an interim reprieve for goods covered under the United States-Mexico-Canada Agreement (USMCA), delaying some tariffs on Canada and Mexico until April 2. In response, China swiftly retaliated by imposing tariffs ranging from 10% to 15% on US agricultural products, among other countermeasures. It is important to note that China's response to the US's broad tariffs has been relatively restrained. In terms of numbers, China’s export growth has already slowed amid heightened trade uncertainty, as shown in chart 1. This slowdown is partly due to the easing of growth following prior front-loading of exports, as well as a decline in imports driven by softer demand.

  • This week, we focus on the steel and aluminium sector, following last week’s round of tariff measures from the US administration. President Trump’s 25% tariffs on steel and aluminium are aimed at addressing concerns over unfair trade practices and excess capacity, with China explicitly singled out as a major contributor to these issues. However, it remains to be seen whether these tariffs will effectively resolve the problems they are intended to address, especially since China’s share of US imports in these sectors is relatively small (chart 1). In fact, Canada is the largest supplier of these products to the US (chart 2), and may face cumulative tariffs of 50% if all of the US's announced measures against the country are implemented. That said, even with these steep tariffs, the immediate impact on Canada’s exports and broader economy may be limited, given that steel and aluminium exports account for a small portion of Canada’s overall exports (chart 3).

    Delving deeper into China’s overcapacity issues, several indicators continue to signal persistent challenges, such as the ongoing deflation in producer prices for related metal products and broader export prices (chart 4). A closer look at China’s steel industry shows that local producers have been struggling long before the prospect of Trump’s tariffs re-emerged (chart 5), facing weak domestic demand and fierce competition that have driven prices down. Beyond tariffs, we also touch on political interventions driven by national security concerns, such as the US blocking Nippon Steel’s acquisition of US Steel, though President Trump has recently signalled some flexibility on this matter. While this transaction is small in the context of Japan’s broader foreign direct investment in the US (chart 6), it highlights the intersection of trade and national security policies.

    The US’ latest tariff actions On February 10th, US President Trump escalated his tariff actions by announcing a 25% tariff on all US steel and aluminium imports, set to take effect on March 12. According to the White House, this move is intended to protect the US steel and aluminium industries, which are said to have been negatively impacted by unfair trade practices and global excess capacity. Specifically, China has been identified as one of the key sources of this excess capacity.

    However, according to official figures, China’s share of US steel imports is relatively small, accounting for less than 2% by the end of last year, as shown in chart 1. China’s share of aluminium imports to the US is higher but still not dominant, at around 10%. These statistics may not fully capture the situation, however, as some US steel and aluminium imports could have been rerouted from other countries, possibly to bypass previous tariffs, before ultimately entering the US market. This rerouting may be a key factor in President Trump's decision to impose blanket tariffs this time, rather than offering exemptions as in previous instances.

  • This week, we explore potential opportunities in Asia if the US ultimately follows through with imposing tariffs on Canadian crude oil exports.

    We begin by acknowledging the US-Canada energy relationship, where Canada has become a dominant supplier of crude oil to the US over the years (chart 1). If a 10% tariff were imposed on Canadian crude, it could result in significant economic disruption for both nations. This reliance on Canadian crude highlights critical aspects of the US energy sector. Although the US is a net exporter of refined oil, it remains heavily dependent on Canada’s heavy, sour crude, particularly for refineries in the Midwest (chart 2). Additionally, fully and immediately replacing this crucial supply is challenging for US refiners, as alternatives like Venezuelan crude are politically unfeasible and currently lack the necessary scale (chart 3).

    However, what may seem disruptive to some presents a window of opportunity to others. With the recently operational Trans Mountain (TMX) pipeline, Canada has improved its access to Asian markets, and China has already begun absorbing a growing share of Canada’s crude oil output (chart 4). The competitive pricing of Canadian crude further enhances its appeal to China’s manufacturers and refiners (chart 5). While it may still be early for Canada to become a major supplier to China—given that countries from the Middle East, Russia, and Africa dominate the market—this shift signals potential for growth (chart 6).

    Nonetheless, the scope and intensity of US trade actions continue to evolve. Recently-announced policy measures include a 25% tariff on all steel and aluminium imports into the US, and observers are now awaiting "reciprocal" tariffs, as promised by US President Trump, set to be revealed later this week.

    The US-Canada energy relationship On February 1 this year, the United States initially announced a 10% tariff on energy imports from Canada, along with a 25% tariff on all other imports, as part of an effort to pressure Canada into addressing US concerns about illegal immigration and the flow of drugs across their shared border. In response, Canada initially announced retaliatory tariffs. However, the situation was temporarily de-escalated after a conversation between US President Trump and Canadian Prime Minister Trudeau. As part of the discussions, Trudeau agreed to ramp up security along the US-Canada border, leading to a one-month delay in the implementation of the tariffs.

    This exchange between the two countries sparked widespread debate on the potential consequences of such tariffs, should they be enforced in the future. One key aspect that emerged from the discussions was the critical energy relationship between the US and Canada. Specifically, Canada’s crude oil exports to the US have become increasingly dominant over the years, as illustrated in chart 1. This growing trend underscores Canada's importance as a key supplier of crude oil to the US, highlighting the potential economic ramifications of any trade barriers between the two nations.

  • This week, we examine the actions taken by the new US administration in the context of Asia. US President Trump is now following through on policies he raised during his electoral campaign, imposing 25% tariffs on Canada and Mexico, and 10% tariffs on China—countries with which the US has the largest trade deficits (chart 1). These measures have already sparked retaliatory actions. As a result, investor concerns about global growth are starting to materialize. Many of our Blue Chip panelists, for instance, having already downgraded their growth forecasts for Asia due to the risks posed by these US actions (chart 2).

    We also explore growing US-China competition in the AI sector, with recent steep market sell-offs (chart 3) following the revelations about China’s DeepSeek AI model. A key factor driving China’s AI ambitions is the availability of AI chips, which faced the possibility of tighter export controls ahead of Trump’s return to office. This likely prompted China to stockpile supplies in anticipation (chart 4) and accelerated its pursuit of semiconductor self-sufficiency.

    Finally, we turn to the Lunar New Year, the Year of the Wood Snake, and examine tourism trends both within China and outbound. Investors and officials alike are closely monitoring Chinese travel patterns—both domestic (chart 5) and international (chart 6)—as a key indicator of consumer health. However, country-specific developments, such as recent abduction scares in Thailand, are threatening to impact Chinese tourism receipts.

    US trade actions so far A trade war may have now begun. US President Donald Trump has followed through on his earlier threats, imposing tariffs on imports from Canada, Mexico, and China. Specifically, Trump announced a 25% tariff on Canadian and Mexican imports, and a 10% tariff on Chinese goods. In response, Canadian Prime Minister Trudeau has introduced retaliatory tariffs of 25% on US imports worth approximately $105 billion. Meanwhile, Mexico and China have vowed to take countermeasures, with China filing proceedings with the World Trade Organization. One of Trump’s key justifications for these actions is to reduce the US’s substantial trade deficit, which is primarily driven by imports from these aforementioned countries, as shown in chart 1.

  • This week, we focus on Japan following last week’s decision by the Bank of Japan (BoJ) to raise interest rates again. That decision brings Japan’s central bank closer to policy normalization, supported by the latest inflation data. However, Japan still has a considerable distance to cover before fully exiting its accommodative monetary policy stance, with the real policy rate remaining deeply negative (Chart 1). A closer look at Japan's inflation dynamics reveals that the recent uptick in price pressures has been driven primarily by fresh food and energy, with specific food items seeing price surges due to supply issues and rising production costs. That said, non-"core core" inflation components continue to show inflation consistently above 2% (Chart 2).

    The outlook from here is increasingly supportive of BoJ tightening, including on the wage front. Annual spring wage negotiations have resulted in rising wage hikes in recent years, with the wage-price dynamic beginning to unfold as the BoJ desired (Chart 3). More recent wage data also shows a broad-based increase, though the manufacturing sector was a laggard in November, amid ongoing challenges (Chart 4). Externally, Japan still has considerable ground to cover in terms of monetary policy compared to its G10 peers. The wide yield differentials between Japan and other economies continue to weigh on the yen, creating unfavourable conditions that impact both locals and foreigners (Chart 5). Finally, like other net exporters to the US, Japan faces ongoing tariff risks, with added uncertainty surrounding its investments in the US (Chart 6).

    The BoJ’s January decision Last Friday, the Bank of Japan (BoJ) raised its policy rate by 25 basis points to "around 0.5%," marking the highest interest rates in 17 years. Leading up to the decision, markets had already priced in the rate hike, following signals from BoJ officials that further tightening was possible in January. In addition, the central bank released updated economic forecasts, now projecting slightly lower real GDP growth for fiscal year 2024 but higher CPI inflation for both fiscal years 2024 and 2025. The upward revision in inflation forecasts coincided with Japan's December CPI report, which showed a notable increase in price pressures, rising to 3.6% y/y, up from 2.9% previously. However, despite the BoJ's rate hike, Japan still has a long way to go before exiting its accommodative monetary policy stance, with the real policy rate remaining deep in negative territory, as illustrated in Chart 1.

  • This week we focus on South Korea, where ongoing political uncertainty continues to weigh on the economy. The Korean won remains under pressure, and equities are struggling to mount a meaningful recovery (Chart 1). The political instability has also dampened both consumer and business sentiment (Chart 2), posing a risk to economic activity if the situation persists or worsens. Focusing on the manufacturing sector, recent PMI readings indicate that the economy has struggled to maintain expansion, suggesting that factors beyond political instability, including external pressures, have been contributing to the challenges (Chart 3). Despite these headwinds, the Bank of Korea (BoK) opted to hold interest rates steady last week, pausing its easing cycle for now, despite the aforementioned economic constraints (Chart 4). A closer look reveals both domestic and external factors likely influenced the BoK’s decision. Domestically, the interim political flux has certainly played a role. Externally, considerations include more muted market expectations of Fed rate cuts this year (Chart 5) and potential trade-related actions from the newly re-elected Trump administration (Chart 6).

    Impacts of recent political developments Political uncertainty continues to weigh heavily on South Korean financial markets, with the won remaining on the back foot after being the worst-performing Asian currency last year. The South Korean won has weakened significantly in recent months, particularly against the US dollar (Chart 1), depreciating by around 11% since early October. While the broader impact of a strengthening dollar has contributed to this decline, the won has been especially impacted by domestic political turmoil, notably following President Yoon's short-lived declaration of martial law last December. Although the currency saw some temporary relief after Yoon's impeachment and arrest, it has yet to mount a substantial recovery, reflecting ongoing instability in South Korea’s political landscape. Meanwhile, equities are still struggling to recover from last year's losses. For context, Yoon declared martial law in early December of last year, accusing the main opposition party of engaging in "anti-state activities" and collaborating with "North Korean communists." This drastic decision followed months of Yoon's deep unpopularity, which some political commentators believe contributed to the opposition party's landslide victory in the parliamentary elections earlier that year. However, Yoon quickly rescinded the declaration just hours after it was made, following its overwhelming rejection by lawmakers and widespread public protests.

  • In our first economic letter of the year, we focus on China. Despite positive economic surprises in recent months (Chart 1) and growth now on track to meet the “around 5%” target, China’s recovery remains uneven and subject to downside risk. In response, China’s authorities have rolled out more fiscal and monetary easing measures (Chart 2), broadening both their scale and their scope. However, some observers continue to question whether these measures will be effective, particularly in addressing deeper structural issues.

    Amid expectations of low interest rates and concerns about a deflationary spiral, investors have bought more Chinese bonds, driving yields to record lows (Chart 3). The continued decline in bond yields prompted the authorities to intervene on Friday and halt further bond purchases. Looking ahead, China faces several challenges, with US trade policy, in particular, a key concern (Chart 4).

    Ahead of potential US trade actions, producers and importers have taken precautionary steps, boosting supplies, and thereby driving China’s export growth in recent months (Chart 5). Nonetheless, export prices have continued to decline, and the yuan has weakened further. Against this backdrop there will be much interest in this week’s upcoming data releases, including the highly anticipated Q4 GDP report (Chart 6).

    Recent developments Although there have been some positive developments, lingering macroeconomic challenges persist. On the one hand, the extent of economic surprises in China, as shown in Chart 1, remains largely positive, with a flurry of positive surprises late last year. On the other hand, concerns in sectors like the property market continue to weigh on the economy. Moreover, the pace of China’s economic recovery remains uneven across sectors, as reflected in the latest PMI readings. The manufacturing sector shows only mild expansions, while the non-manufacturing sector continues to grow at a faster pace. Nonetheless, President Xi has recently stated that China is on track to meet its growth target of "around 5%" for 2024. China’s real GDP growth has certainly stayed close to the 5% target, narrowly missing it with a 4.8% year-over-year growth in Q3.

  • In our penultimate Charts of the Week publication for 2024, we turn our attention to the upcoming year and highlight several themes that are poised to mould the economic and financial market landscape. Although a soft-landing consensus for the world economy is presently implicit in most economic forecasts for next year (chart 1) that view is not without challenges. Uncertainty about the economic outlook has bolted sharply higher in recent weeks (chart 2) partly because of the likely major - and potentially disruptive - policy changes from a new US administration (chart 3). Lingering supply-side challenges, such as climate change and the energy transition, are also generating a great deal of economic and political instability at present, most notably in Europe (charts 4 and 5). In the meantime, many Asian economies face additional challenges, including the potential for higher tariffs on trade (chart 6) and lingering debt-related problems in China (chart 7). Generating sufficient domestic growth momentum to mitigate those problems is also proving to be tough for a number of countries, not least in Japan (chart 8). As Japan’s policymakers are all too aware a key reason for weak domestic demand momentum is ageing demographics, a structural problem that will likely remain in vogue in 2025, not least in the realm of healthcare provision and fiscal policy (chart 9). Geopolitical risks will also likely remain elevated even if there is some progress next year in mitigating those risks in Eastern Europe and the Middle East (chart 10). Finally, and ending on a more positive note, there are some offsets to these downside risks, not least via the productivity-enhancing potential of AI technology (chart 11). The rebound that has been unfolding in the travel and tourism sector in recent months is also noteworthy, and a push back against the trend toward a de-globalisation of the world economy in recent years (chart 12).

  • In this week’s letter, we look back at and review some of the key trends that have shaped the outlook for Asia this year. While growth picked up in several parts of the region earlier in the year, signs of a slowdown have emerged as we head toward year-end (Chart 1). Disinflationary trends have continued in many economies, welcome news for central banks across the region. However, the growth and inflation landscape remains uneven. Economies like Japan and India have experienced slower growth, while others such as Singapore, Taiwan, Malaysia, and Vietnam have seen improvements, in part driven by strong demand for electronics and semiconductors (Chart 2).

    On monetary policy, the anticipated regional alignment with the Fed's easing cycle has not fully materialized. Instead, many central banks in Asia have opted to keep policy rates higher for longer, thanks to the influence of various domestic factors (Chart 3). Touching on semiconductors, key players like Taiwan and South Korea have reaped significant benefits from the AI-driven surge in demand, while China’s pre-emptive purchases of semiconductor equipment have finally started to taper off (Chart 4). Turning to financial markets, Asian equities largely tracked their US counterparts through early October. However, market expectations were disappointed by China’s underwhelming stimulus plans, triggering sell-offs across regional markets, while US equities maintained a broader upward trend (Chart 5).

    Lastly, in the political arena, both India and Japan saw their incumbent governments retain power, although with notable losses in parliamentary seats, raising some concerns over future economic policy direction (Chart 6). And as we head into December, uncertainty remains—particularly following President-elect Trump’s recent victory in November. We will continue to explore these developments and their potential impact for 2025 in next week’s publication.

    Growth and inflation Asia-Pacific economies had plenty to celebrate this year, as growth strengthened on average while inflation remained well-behaved in many economies. As shown in Chart 1, GDP growth rates rose from the lows of 2023, averaging just under 4% y/y in both Q1 and Q2. That said, while growth momentum persisted in some economies during Q3, it slowed further in many others. Meanwhile, the region experienced further disinflation, with average CPI inflation falling from a peak of 2.9% y/y in May to just 2% in October—a level at which many central banks would likely feel comfortable. However, a deeper dive into economy-specific nuances reveals disparities in the relationship between growth and inflation across the region's economies—an issue we will explore in the next section.

  • In this week’s letter, we focus on Southeast Asia (ASEAN). While exports have become increasingly important to ASEAN economies as drivers of real GDP growth, secondary growth drivers offer a buffer in the event of dampened external demand. A deeper look at the composition of ASEAN’s export value added reveals that intermediate goods account for the largest share, compared to finished goods. This highlights the region’s key role as a hub in the global supply chain. We also explore the differences among ASEAN economies. On the one hand, resource-rich countries like Indonesia and Malaysia benefit from their role as exporters of raw or partially processed commodities. On the other, resource-scarce economies like Singapore have carved out a niche in higher-end manufacturing, often relying on inputs from other regions.

    Overall, ASEAN remains a bright spot for growth, with IMF forecasts suggesting that the region is poised to outpace other Asian economies, including China, over the next decade. However, the region’s prospects are not without risks. The US trade deficit with many ASEAN economies, particularly Vietnam, could provoke trade-related actions from US President-elect Trump. Ironically, Vietnam’s rise—largely driven by its strategic positioning amid US-China tensions during Trump’s first term—may also lead to increased scrutiny in his second term. Finally, we examine the industrial policies of certain ASEAN economies, particularly Indonesia. While the success of its nickel ore export ban is notable, similar export bans on commodities like bauxite have had more mixed success.

    ASEAN’s place in trade and the world Trade has long been crucial to the economies of Southeast Asia (ASEAN), with export revenues serving as a significant driver of growth for several countries in the region. In recent quarters, this role has become even more pronounced, as evidenced in Chart 1, which shows rising export contributions to growth for Malaysia, Thailand, and Indonesia. In contrast, the Philippines continues to struggle to generate growth from its exports. However, unlike advanced Asian economies such as South Korea and Taiwan, many ASEAN countries have benefited from strong secondary growth drivers, particularly private consumption. A robust domestic consumer base has supported business activity across the region. This dynamic provides a buffer in times of reduced global demand, which may dampen export performance. Even if external conditions weaken, these economies may still rely on internal demand to sustain growth, provided their domestic situations remain stable.