 Global| Aug 16 2007
TIC Data Show Sizable Foreign Interest in US Securities Even Through June; Hong Kong, Russia & Brazilian Investors [...]
Summary
The US Treasury's monthly "TIC" data were reported yesterday for June. They indicate that foreign interest in US capital markets remained strong with the same magnitude of net flows into the US as occurred in May, the record period. [...]
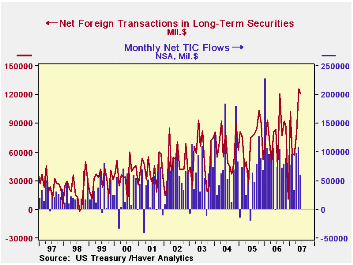
The US Treasury's monthly "TIC" data were reported yesterday for June. They indicate that foreign interest in US capital markets remained strong with the same magnitude of net flows into the US as occurred in May, the record period. Foreign investors bought $148.6 billion of US securities compared with $163.7 billion in May and "just" $91.8 billion in June 2006. At the same time, US investors bought $27.8 billion of foreign securities in June, noticeably less than May's $37.6 billion, but still historically large.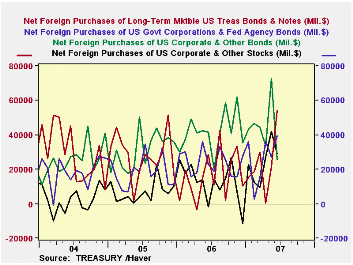
The mix of US securities purchased by foreign investors shifted considerably from May to June. After May's outsized amount of corporate bonds, $72.6 billion, they bought only about one-third as much in June, $25.9 billion. Purchases of equities also decreased, from $42.0 billion in May to $28.8 billion. But net buying of federal agency and Treasury securities both established new records: agency debt advanced from $27.5 billion to $39.7 billion and Treasury purchases from $21.6 billion to $54.3 billion.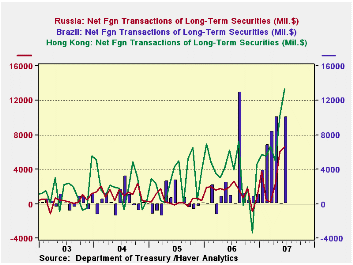
Last month, we commented here on the increased participation by Chinese investors in US markets. This expanded further in June, with $20.2 billion in net purchases, up from $10.1 billion in May. The London markets reduced their US buying, but at $66.7 billion, it remained large compared with both most previous periods and other investment centers. Speaking of other investment centers, a number of them were active in June: Hong Kong investors bought, on net, a record $13.3 billion; the Cayman Islands, $11.1 billion, about average for them; and Russia $6.6 billion, also a record and following $6.0 billion in May. The one we found interesting was Brazil, whose investors purchased $10.1 billion in June and a total of $20 billion during the second quarter. The June amount was more than accounted for with $12.2 billion in Treasuries. Euro-Zone investors, by contrast, were net sellers of $20 billion in US securities markets in June, consisting of a large portion of foreign stock sales to US investors.
| Net ForeignPurchases fromUS Residents, Bil $ | June 2007 | May 2007 | June 2006 | Monthly Averages||||
|---|---|---|---|---|---|---|---|
| Last 12 Months | 2006 | 2005 | 2004 | ||||
| "Headline": Net Foreign Purchases = 1 + 2 | 120.9 | 126.0 | 83.5 | 81.4 | 73.7 | 69.9 | 63.6 |
| Domestic Securities | 148.6 | 163.7 | 91.8 | 107.0 | 94.6 | 84.3 | 76.4 |
| Treasuries | 54.3 | 21.6 | 28.7 | 22.1 | 16.3 | 28.2 | 29.3 |
| Agencies | 39.7 | 27.5 | 23.0 | 24.5 | 24.1 | 18.3 | 18.9 |
| Corporate Bonds | 25.9 | 72.6 | 41.7 | 43.6 | 41.7 | 31.0 | 25.8 |
| Equities | 28.8 | 42.0 | -1.6 | 16.9 | 12.5 | 6.8 | 2.4 |
| Foreign Securities | -27.8 | -37.6 | -8.3 | -25.7 | -20.9 | -14.4 | -12.7 |
| Net Foreign Acquisition | 107.0 | 112.5 | 67.8 | 67.9 | 60.7 | 58.3 | 60.4 |
| Total TIC Flows | 58.8 | 107.3 | -2.6 | 73.6 | 87.4 | 55.7 | 81.6 |
| Select Countries Net Purchases of US Securities | |||||||
| China | 20.2 | 10.1 | 12.2 | 11.0 | 9.1 | 7.2 | 3.9 |
| United Kingdom | 66.7 | 92.7 | 57.2 | 47.0 | 38.7 | 30.3 | 21.2 |
by Robert Brusca August 16, 2007
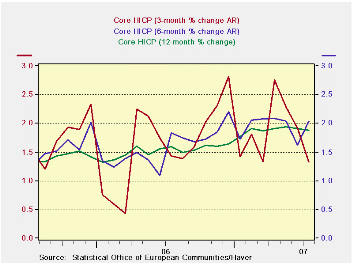
Inflation trends are peaking and falling in the Euro area with the key core measure. Still that core measure is hugging the 2% ceiling rate for the overall HICP. While Year/year inflation is lower and 3-month inflation is lower 6-month inflation is NOT.
Overall and core rate of inflation are mostly conforming to the ECB ceiling across major countries. There is no sense of accelerating inflation in this group and that is certainly good news. The bad news is that the trends for the components of inflation are more decidedly mixed. While goods price inflation is still falling (and that one contains oil and gas price effects), services inflation is high and accelerating. It may contain some energy price impacts as well, but the speed right now is over the top of acceptability. Internal inflation (services) can be more stubborn than goods inflation. These days, due to international competition, goods price inflation tends to be better behaved. Pressure from services prices tends to be longer lived while goods price oscillations may not be so permanent. As a result the drop in goods prices that helped to contain the overall HICP is to be closely watched in the coming months. We obviously want to see as well the service sector trends and how much they are able to deflate.
| M/M % Change | % SAAR | ||||||
| Jul-07 | Jun-07 | May-07 | 3-Mo | 6-Mo | 12-Mo | Yr Ago | |
| EMU-13 | 0.1% | 0.2% | 0.2% | 2.0% | 2.6% | 1.8% | 2.4% |
| Core | 0.1% | 0.1% | 0.1% | 1.3% | 2.0% | 1.9% | 1.6% |
| Goods | -1.0% | 0.0% | 0.2% | -2.9% | 2.6% | 1.2% | 2.7% |
| Services | 0.8% | 0.2% | 0.2% | 5.2% | 4.5% | 2.6% | 2.1% |
| HICP | |||||||
| Germany | 0.2% | 0.2% | 0.2% | 2.3% | 2.5% | 2.0% | 2.1% |
| France | 0.0% | 0.2% | 0.2% | 2.0% | 2.1% | 1.2% | 2.2% |
| Italy | -0.1% | 0.3% | 0.3% | 1.9% | 2.7% | 1.7% | 2.3% |
| UK | -0.3% | 0.3% | 0.1% | 0.4% | 1.5% | 1.9% | 2.4% |
| Spain | 0.2% | 0.3% | 0.3% | 3.1% | 3.4% | 2.3% | 4.0% |
| Core:xFE&A | |||||||
| Germany | 0.2% | 0.1% | 0.3% | 2.4% | 2.4% | 2.1% | 1.0% |
| France | 0.0% | 0.1% | 0.1% | 1.1% | 1.3% | 1.4% | 1.5% |
| Italy | 0.0% | 0.1% | 0.2% | 1.2% | 3.0% | 1.8% | 1.7% |
| UK | -0.1% | 0.1% | 0.3% | 1.2% | 1.6% | 1.8% | 1.2% |
| Spain | 0.2% | 0.2% | 0.1% | 2.2% | 2.3% | 2.4% | 3.2% |
by Robert Brusca August 16, 2007
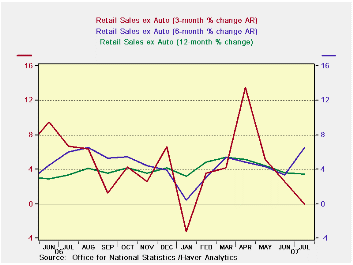
In the new third quarter, UK real retail sales excluding autos were up strongly - in July. Real retail sales are rising at a 7% annual rate in the new quarter. Real ex-auto retail sales are ramping up in terms of 3-month and 6-month trends as well. The UK is one country in the EU where consumers seem to have stepped up. In Germany growth has been strong but the consumer has lagged. In France recent stock market events have been worse than in other countries and its business surveys have weakened. The consumer remains the key to the next leg up in growth in Europe and only in the UK do we have evidence that the consumer is ready to comply.
| Nominal | Jul-07 | Jun-07 | May-07 | 3-MO | 6-MO | 12-MO | Yr Ago |
| Retail Total | -0.2% | 0.3% | -0.1% | 0.0% | 6.5% | 3.5% | 3.3% |
| Food Beverages & Tobacco | -0.4% | -0.5% | -0.3% | -4.4% | 0.6% | 0.8% | 5.3% |
| Clothing Footwear | -0.5% | 0.2% | -4.3% | -17.1% | 9.7% | 1.6% | 5.6% |
| Real | |||||||
| Retail ex auto | 0.7% | 0.4% | 0.4% | 6.4% | 8.1% | 4.4% | 4.1% |
by Tom Moeller August 16, 2007
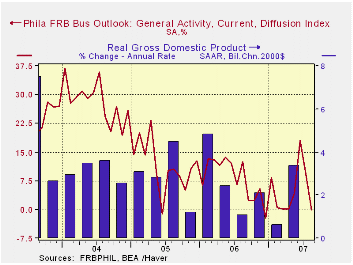
The Philadelphia Federal Reserve Bank's Index of General Business Conditions in the manufacturing sector fell more than expected during August. The drop to 0.0 from 9.2 indicated that activity was "steady," but Consensus expectations had been for a reading that was roughly unchanged from July at 10.
During the last ten years there has been a 65% correlation between the level of the Philadelphia Fed Business Conditions Index and three month growth in factory sector industrial production. There has been a 43% correlation with q/q growth in real GDP.
The sub indexes for new orders, shipments, unfilled orders and inventories all fell, the latter two into negative territory. The employment reading, however, improved to its best reading since 2004. During the last ten years there has been a 75% correlation between the employment index and the three month growth in factory payrolls.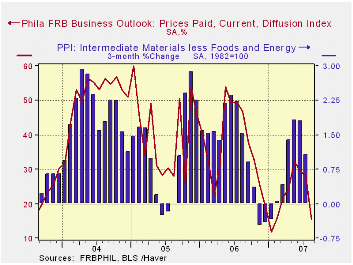
The business conditions index reflects a separate survey question, not the sub indexes.
The prices paid index fell for the third consecutive month, back to its lowest level since January. During the last ten years there has been a 76% correlation between the prices paid index and the three month growth in the intermediate goods PPI. There has been an 85% correlation with the change in core intermediate goods prices.
The separate index of expected business conditions in six months rose to its best level since late in 2004.
The latest Business Outlook survey from the Philadelphia Federal Reserve Bank can be found here.
The latest Survey of Professional Forecasters from the Federal Reserve Bank of Philadelphia can be found here.
| Philadelphia Fed Business Outlook | August | July | Aug. ‘06 | 2006 | 2005 | 2004 |
|---|---|---|---|---|---|---|
| General Activity Index | 0.0 | 9.2 | 12.6 | 8.1 | 11.5 | 28.1 |
| Prices Paid Index | 15.4 | 28.1 | 46.6 | 36.6 | 40.1 | 51.2 |
by Tom Moeller August 16, 2007
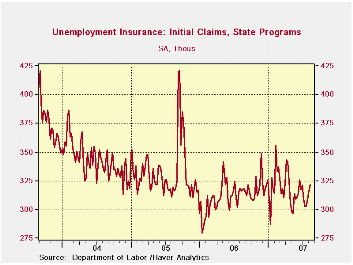
Initial claims for unemployment insurance rose again last week. This third increase in as many weeks was to 322,000 from an unrevised 316,000 during the opening week of the month. The increase exceeded Consensus expectations for 315,000 claims in the latest week.
A claims level below 400,000 typically has been associated with growth in nonfarm payrolls. During the last ten years there has been a (negative) 78% correlation between the level of initial claims and the m/m change in nonfarm payroll employment.
The four-week moving average of initial claims rose to 312,500 (-0.2% y/y), its highest level in one month.
Continuing claims for unemployment insurance rose 17,000 after a downwardly revised 16,000 increase during the prior week. The continuing claims numbers lag the initial claims figures by one week.
The insured rate of unemployment remained at 1.9%.
Family Caregiver: Balancing Home and Work from the Federal Reserve Bank of Boston is available here.
| Unemployment Insurance (000s) | 08/11/07 | 08/04/07 | Y/Y | 2006 | 2005 | 2004 |
|---|---|---|---|---|---|---|
| Initial Claims | 322 | 316 | 1.9% | 313 | 331 | 343 |
| Continuing Claims | -- | 2,567 | 3.1% | 2,545 | 3.3% | 2,459 |
by Tom Moeller August 16, 2007
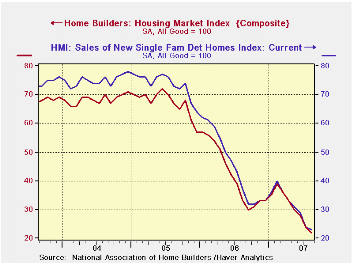
The Composite Housing Market Index from the National Association of Home Builders' (NAHB) fell hard this month to the lowest level since early 1991. At 22, for August, the index fell 8.3% from July after a 14.3% during that month.
During the last twenty years there has been a 76% correlation between the y/y change in the Composite Index and the change in single family housing starts.
The sub-index for current sales also was down and fell 4.2% (-37.8% y/y) from July. The sub-index covering prospective sales in the next six months dropped 5.9% m/m (-22.0% y/y).
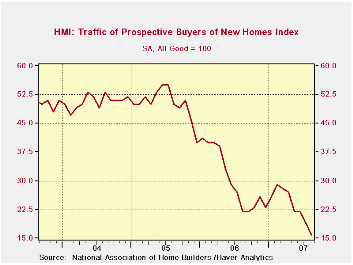
Traffic of prospective home buyers fell 15.8% m/m (-27.3% y/y).
The NAHB index is a diffusion index based on a survey of builders. Readings above 50 signal that more builders view conditions good than poor.
Visit the National Association of Home Builders.
| Nat'l Association of Home Builders | August | July | Aug. '06 | 2006 | 2005 | 2004 |
|---|---|---|---|---|---|---|
| Composite Housing Market Index | 22 | 24 | 33 | 42 | 67 | 68 |
by Tom Moeller U.S. Housing Starts At Ten Year LowAugust 16, 2007
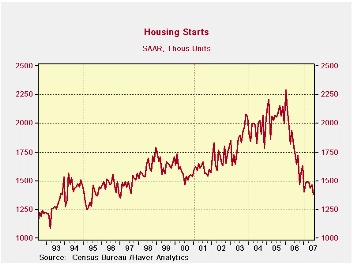
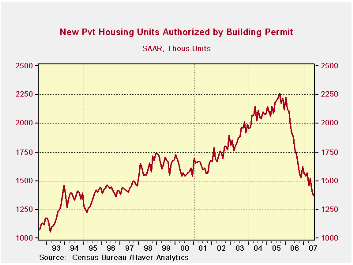
July housing starts fell a whopping 6.1% m/m to 1.381M units. Not only did to the decline slightly exceed Consensus expectations for a drop to 1.39M starts. It was to the lowest level since early 1997 and the month-to-month decline was the largest since this past January.
Single-family starts declined 7.3% to 1.07M units, down for the fifth month this year. In this sector, the drop in fact was to the lowest level since 1996.
Single family starts fell hard across the country with the Northeast leading the pack with a 12.0% (-7.8% y/y) decline. Single family starts in the Midwest also fell a hard a 9.2% (-25.8% y/y) and starts in the South fell 6.2% (-29.5% y/y). Finally, single family starts in West fell 6.4% (-21.2% y/y).
Starts of multi-family structures picked up a piece of the slack and posted just a 1.6% (-0.3% y/y) decline to 311,000.
Building permits also were weak and fell 2.8% m/m to their lowest level since 1996. Permits to build a single family home: the lowest since 1995.
The Role of House prices in Formulating Monetary Policy is a speech given by Federal Reserve Board Governor Frederic S. Mishkin.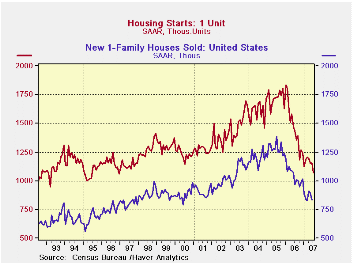
| Housing Starts (000s, AR) | July | June | Y/Y | 2006 | 2005 | 2004 |
|---|---|---|---|---|---|---|
| Total | 1,380 | 1,470 | -20.9% | 1,819 | 2,073 | 1,950 |
| Single-family | 1,070 | 1,154 | -25.4% | 1,478 | 1,719 | 1,604 |
| Multi-family | 311 | 316 | -0.3% | 341 | 354 | 345 |
| Building Permits | 1,373 | 1,413 | -22.6% | 1,834 | 2,159 | 2,058 |
Carol Stone, CBE
AuthorMore in Author Profile »Carol Stone, CBE came to Haver Analytics in 2003 following more than 35 years as a financial market economist at major Wall Street financial institutions, most especially Merrill Lynch and Nomura Securities. She had broad experience in analysis and forecasting of flow-of-funds accounts, the federal budget and Federal Reserve operations. At Nomura Securities, among other duties, she developed various indicator forecasting tools and edited a daily global publication produced in London and New York for readers in Tokyo. At Haver Analytics, Carol was a member of the Research Department, aiding database managers with research and documentation efforts, as well as posting commentary on select economic reports. In addition, she conducted Ways-of-the-World, a blog on economic issues for an Episcopal-Church-affiliated website, The Geranium Farm. During her career, Carol served as an officer of the Money Marketeers and the Downtown Economists Club. She had a PhD from NYU's Stern School of Business. She lived in Brooklyn, New York, and had a weekend home on Long Island.
More Economy in Brief
 Global| Feb 05 2026
Charts of the Week: Balanced Policy, Resilient Data and AI Narratives
by:Andrew Cates


