 Global| Jan 18 2007
Total Housing Starts Rise, But Single-Family Units Fall Anew
Summary
December housing starts appeared to gain some forward momentum, with a 4.5% advance. The resulting 1.642M was considerably better than Consensus expectations for renewed decline to 1.563M starts. For all of 2006 starts of 1.819M was [...]
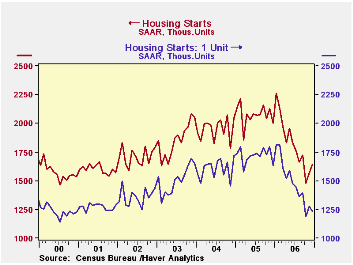
December housing starts appeared to gain some forward momentum, with a 4.5% advance. The resulting 1.642M was considerably better than Consensus expectations for renewed decline to 1.563M starts.
For all of 2006 starts of 1.819M was 12.3% below the 2005 total.
However, the December increase was all in multi-family structures. These jumped 42.1% in the month to 412,000, the largest since January. Multi-family building starts have been running just below 350,000 yearly for about the last ten years.
Disappointingly, single-family starts in December turned back down again, losing 4.1% to 1.23M. For the year as a whole, they totaled 1.478M, actually an annual rate not seen since June. This is 14.0% below 2005's total; as seen in the table below, the month of December was almost 25% below December 2005..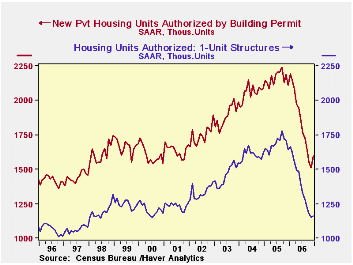
By region, single-family housing starts in the South lost 5.7% in December (-26.3% y/y); at 642,000, this is 8.6% above October's low. Single-family starts in the Northeast were off 3.5% (-14.0% y/y). Starts in the Midwest fell 4.7% (-26.4% y/y) and out West, they managed to hold steady at 293,000 for a third consecutive month, down 23.5% December/December.
Building permits gained 5.5% in the month, but here too, the increase was mainly in the volatile multi-family sector. These permits rose 69,000 to 432,000, the best volume since August. Permits to start single-family homes edged up 1.2%, their first increase since January. For the year as a whole, these permits totaled 1.38M, down 18.0% from 2005. Total building permits for the 1.834M, down 15.1% from 2005.
New Federal Reserve Board Governor Frederic Mishkin gave his first speech as a Board Member yesterday in New York. It is titled, appropriately enough, The Role of House Prices in Formulating Monetary Policy and can be found here. Chairman Bernanke testified this morning before the Senate Budget Committee; his prepared statement, Long-term fiscal challenges facing the United States, can be found here.
| Housing Starts (000s, AR) | December | November | October | Y/Y | 2006 | 2005 | 2004 |
|---|---|---|---|---|---|---|---|
| Total | 1,642 | 1,572 | 1,478 | -18.0% | 1,819 | 2,073 | 1,950 |
| Single-family | 1,230 | 1,282 | 1,187 | -24.7% | 1,478 | 1,719 | 1,604 |
| Multi-family | 412 | 290 | 291 | 11.7% | 341 | 354 | 345 |
| Building Permits | 1,596 | 1,513 | 1,553 | -24.3% | 1,834 | 2,159 | 2,058 |
by Carol Stone January 18, 2007
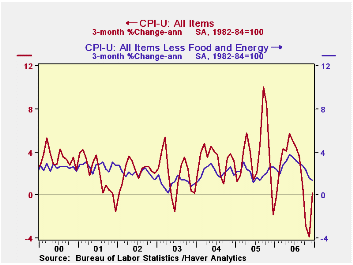
The December consumer price index (CPI-U) rose 0.5% after November's flat reading. In fact, this was the first increase since August. The monthly change was in line with consensus expectations at a 0.5% rise. The 12-month inflation was 2.6%, less than 3.4% in 2005.
Prices less food & energy were up 0.2%; they had been unchanged in November. This too matched consensus expectations, at a 0.2% increase. The December-on-December rate was 2.6%, the same as the total.
Core goods prices were unchanged in December, following three consecutive declines; the year-on-year pace was +0.2%. The December mix included gains in apparel (0.6%), tobacco (1.5%) and personal care products (1.9%). Declines included new & used motor vehicles (-0.3%), medical care commodities (0.2%) and audio/video equipment (0.7%). Computer prices were unchanged. 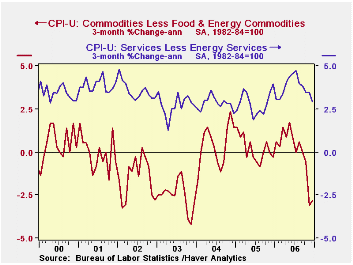
Core services prices repeated their November 0.2% increase. In fact, carried to a second decimal place, December, at 0.20%, had the smallest increase since last January, 0.17%. Shelter slowed back to a 0.3% rise from 0.4% in November; public transportation continued to fall, but just 0.2% in December after 1.9% in November. Information technology and services were down 1.8%, but this was the smallest decline in recent months, following, for instance, 4.2% in November. Medical services were up just 0.2% and education increased 0.5%. Despite the huge rise in personal care products, personal care services inched up only 0.1%.
Energy prices rebounded sharply, up 4.6% on the month. This put them up 3.1% from December 2005. Gasoline prices surged 8.0% in December, heating oil rose 3.2% and piped gas and electricity were up 1.2%.
Food & beverage prices were unchanged in December. Fruits and vegetables prices dropped 1.5%, their second consecutive sizable decline. Cold weather in the South this month, though, may make such declines short-lived. Nonalcoholic beverages, alcoholic beverages and cooking fats and oils also declined. Dairy product prices steadied with a 0.1% rise after their November fall of 0.6%, and prices for meats, poultry, fish & eggs also rose 0.1%, a bit slower than November's 0.2%. Cereals were up 0.4%, the same as in November.
The chained CPI, which adjusts for shifts in the mix of consumer purchases, was up just 0.1% in December and the chained "core" fell 0.2%.
| Consumer Price Index | December | November | Y/Y | 2006 | 2005 | 2004 |
|---|---|---|---|---|---|---|
| Total | 0.5% | 0.0% | 2.6% | 3.2% | 3.4% | 2.7% |
| Total less Food & Energy | 0.2% | 0.0% | 2.6% | 2.5% | 2.2% | 1.8% |
| Goods less Food & Energy | 0.0% | -0.4% | -0.1% | 0.2% | 0.5% | -0.9% |
| Services less Energy | 0.2% | 0.2% | 3.7% | 3.4% | 2.8% | 2.8% |
| Energy | 4.6% | -0.2% | 3.1% | 11.1% | 16.9% | 10.8% |
| Food & Beverages | 0.0% | -0.1% | 2.2% | 2.3% | 2.4% | 3.4% |
| Chained CPI: Total (NSA) | 0.1% | -0.2% | 2.4% | 2.9% | 2.9% | 2.5% |
| Total less Food & Energy | -0.2% | -0.2% | 2.3% | 2.3% | 1.9% | 1.7% |
by Carol Stone January 18, 2007
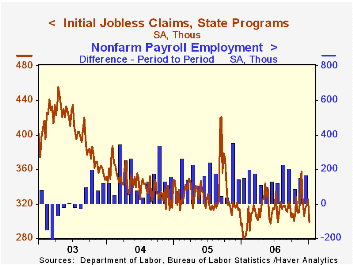
Initial unemployment insurance claims continued to fall last week, decreasing 8,000 to 290,000, now the lowest level since last February. Consensus expectations had been for 310,000, which would have meant some reversal of the previous week's decline.
During the last ten years there has been a (negative) 77% correlation between the level of initial claims and the m/m change in nonfarm payroll employment.
The four-week moving average of initial claims also fell, reaching to 308,000 (+3.7% y/y). 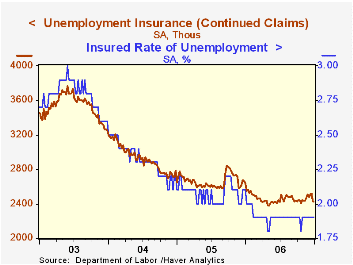
In contrast, continuing claims for unemployment insurance rebounded in the January 6 week, with a rise of 120,000 to 2,530,000, almost exactly reversing the prior two weeks' combined 112,000 drop.
The insured rate of unemployment returned to 1.9% after a dip to a downward revised 1.8% in the December 30 week. At the very beginning of 2006, the rate was 2.0%, but since February it has hovered at 1.9%, with the occasional 1.8%.
| Unemployment Insurance (000s) | 01/13/07 | 01/06/07 | 12/30/07 | Y/Y | 2006 | 2005 | 2004 |
|---|---|---|---|---|---|---|---|
| Initial Claims | 290 | 298 | 325 | 3.2% | 313 | 332 | 343 |
| Continuing Claims | -- | 2,530 | 2,410 | -0.8% | 2,459 | 2,662 | 2,924 |
Carol Stone, CBE
AuthorMore in Author Profile »Carol Stone, CBE came to Haver Analytics in 2003 following more than 35 years as a financial market economist at major Wall Street financial institutions, most especially Merrill Lynch and Nomura Securities. She had broad experience in analysis and forecasting of flow-of-funds accounts, the federal budget and Federal Reserve operations. At Nomura Securities, among other duties, she developed various indicator forecasting tools and edited a daily global publication produced in London and New York for readers in Tokyo. At Haver Analytics, Carol was a member of the Research Department, aiding database managers with research and documentation efforts, as well as posting commentary on select economic reports. In addition, she conducted Ways-of-the-World, a blog on economic issues for an Episcopal-Church-affiliated website, The Geranium Farm. During her career, Carol served as an officer of the Money Marketeers and the Downtown Economists Club. She had a PhD from NYU's Stern School of Business. She lived in Brooklyn, New York, and had a weekend home on Long Island.
More Economy in Brief
 Global| Feb 05 2026
Charts of the Week: Balanced Policy, Resilient Data and AI Narratives
by:Andrew Cates


