 Global| Oct 25 2010
Trade Weighted Exchange Rates
Summary
With the up coming summit meeting of the Group of 20 leading economies on November 11th and 12th in Seoul, Korea exchange rates will be high on the agenda. The finance ministers and central bankers of the 20 met in Gyeongju, Korea [...]
With the up coming summit meeting of the Group of 20 leading economies on November 11th and 12th in Seoul, Korea exchange rates will be high on the agenda. The finance ministers and central bankers of the 20 met in Gyeongju, Korea over this past weekend to set the agenda. In addition to exchange rates, world trade imbalances and reform of the International Monetary Fund shifting some of its powers from Europe to the emerging nations will be at issue.
Just what has happened to exchange rates over the recent past? Comparisons among spot exchange rates are frequently difficult to make. Some exchange rates are expressed in foreign currency/local currency and others in local currency/foreign currency. In addition, the magnitude of the exchange rate varies from 1.02 for the Canadian Dollar to the U.S. Dollar to 8937 Indonesian Rupiahs to the U. S. Dollar as of October 22, 2010.
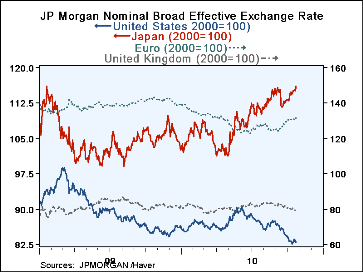
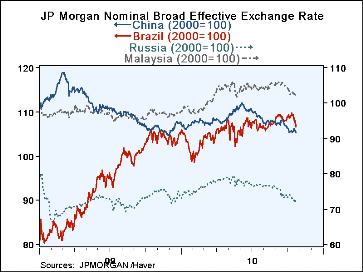
The trade weighted effective exchange rates are easier to compare. There are generally four sets of trade weighted exchange rates for each country--Broad Nominal, Broad Real, Narrow Nominal and Narrow Real. In the attached charts we have used the Broad Nominal Exchange rates. In the first chart we show the exchange rates for a sample of developed nations: the U.S. Japan, the Euro Area and the United Kingdom. The Japanese Yen has risen sharply over the past two years, the Euro somewhat less so. Both the dollar and the U.K. pound have declined steadily. In the second chart we show the exchange rates for a sample of four Emerging Countries-China, Russia, Malaysia and Brazil. The trade weighted Brazilian real has shown the most appreciation up until the current mid year. The Russian real and the Malaysian ringgit appreciated moderately over the same period. Since then all three have depreciated. Except for a slight appreciation, early in 2009 and in the second quarter of this year, the broad nominal trade weighted Chinese Yuan has been in a declining trend.
| Trade Weighted Broad Nominal Exchange Rate(2000=100) | Oct 22, 2010 |
|---|---|
| United States Dollar | 83.4 |
| United Kingdom Pound | 79.2 |
| Euro Area Euro | 131.6 |
| Japan Yen | 115.2 |
| China Yuan | 105.9 |
| Russia Ruble | 72.9 |
| Malaysia Ringgit | 102.6 |
| Brazil Real | 107.7 |


