 Global| Apr 18 2007
Treasury TIC Data Show Reduced Security Purchases, but More Inflows of Other Capital
Summary
The US Treasury's monthly investment data, called "Treasury International Capital" data or "TIC", are increasingly watched for trends in foreign investors' interest in US capital markets. Data for February were released this Monday [...]

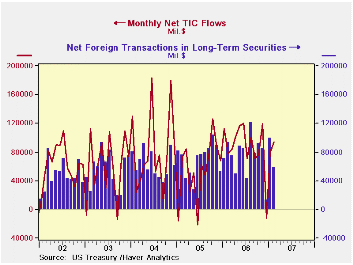
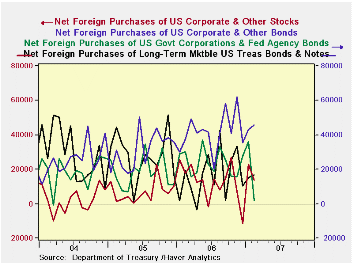
The US Treasury's monthly investment data, called "Treasury International Capital" data or "TIC", are increasingly watched for trends in foreign investors' interest in US capital markets. Data for February were released this Monday past. Net purchases of securities by foreign investors appear to have fallen to $58.1 billion from $98.8 billion in January and $93.4 billion in February 2006. The reduction in February consists of smaller net purchases of federal agency (GSE) debt and US equities than in January, modestly offset by slight increases in Treasuries and corporate bonds. US investors also bought slightly more in foreign securities in February. So in the securities markets, less foreign capital came into the US and a bit more US capital went out.
These data contain two important lessons that caution us against making too much of one month's figures. First, they obviously move around a lot. Foreign purchases of domestic securities were $116.8 billion in January and dropped to "only" $77.9 billion in February. This included the largest ever monthly swing in net purchases of federal agencies, -$33.2 billion, while net purchases of corporate bonds were the fifth largest they had ever been. And even though purchases of equities diminished, they remain quite large by historical comparison. The monthly data on security purchases run back to 1977.
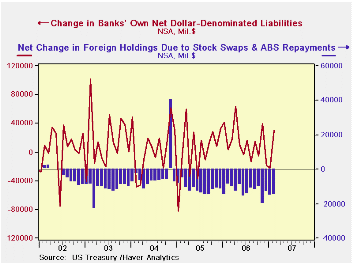
At the same time, these figures do just cover security purchase and sale transactions. But there are other financial flows, of course. Since last November 16 (see our commentary for that date), the Treasury has highlighted more information on these in a new "TIC Monthly Report on Cross-Border Financial Flows". This table includes "other securities acquisition", which tends to run negative as periodic principal payments are made on pass-through securities; stock swaps are also in this category and can run both ways as multinational corporations alter ownership structures. Also included in the Treasury's summary table are non-security transactions: short-term custody holdings and changes in banks' dollar-denominated liabilities. Both of these can be highly variable, and indeed, the latter item, Line 6 in the table below, swung from a net outflow of $22.4 billion in January to an inflow of $30.4 billion in February.
Thus, overall, the influx of capital to the US did not decrease in February, but it increased, to $94.5 billion from $79.6 billion in January and $77.5 billion a year ago. We have argued before and would repeat, that in these monthly capital flow data, the items that "balance" the "balance of payments" are in fact the transitory ones, the cash moving around the world financial system as trade flows are paid for and companies shift deposits to countries where they have upcoming expenditures. Security purchases represent entirely different kinds of business decisions and may not necessarily be tied to the trade or current account deficits.
| Net Foreign Purchases fromUS Residents, Bil $ | Feb 2007 | Jan 2007 | Feb 2006 | Monthly Averages||||
|---|---|---|---|---|---|---|---|
| Last 12 Months | 2006 | 2005 | 2004 | ||||
| "Headline": Net Foreign Purchases = 1 + 2 | 58.1 | 98.8 | 93.4 | 73.6 | 74.3 | 69.9 | 63.6 |
| 1. Domestic Securities | 77.9 | 116.8 | 105.0 | 95.1 | 94.8 | 84.3 | 76.4 |
| Treasuries | 17.0 | 15.2 | 19.4 | 17.4 | 16.5 | 28.2 | 29.3 |
| Agencies | 2.0 | 35.8 | 30.1 | 22.3 | 24.1 | 18.3 | 18.9 |
| Corporate Bonds | 45.4 | 43.0 | 37.7 | 43.4 | 41.7 | 31.0 | 25.8 |
| Equities | 13.5 | 22.8 | 17.8 | 12.0 | 12.5 | 6.8 | 2.4 |
| 2. Foreign Securities | -19.8 | -17.9 | -11.5 | -21.5 | -20.6 | -14.4 | -12.7 |
| 3. "Other Acquisition"* | -15.0 | -15.1 | -9.0 | -13.3 | -12.8 | -11.7 | -3.2 |
| 4. Net Foreign Acquisition (1+2+3) | 43.2 | 83.7 | 84.4 | 60.3 | 61.5 | 58.3 | 60.4 |
| 5. Short-Term Liabilities | 20.8 | 17.9 | -10.6 | 14.1 | 11.2 | -4.0 | 15.8 |
| 6. Change in Bank Liabilities | 30.4 | -22.0 | 3.7 | 10.8 | 13.9 | 1.4 | 5.3 |
| 7. Total TIC Flows** | 94.5 | 79.6 | 77.5 | 85.2 | 86.6 | 55.7 | 81.6 |
Carol Stone, CBE
AuthorMore in Author Profile »Carol Stone, CBE came to Haver Analytics in 2003 following more than 35 years as a financial market economist at major Wall Street financial institutions, most especially Merrill Lynch and Nomura Securities. She had broad experience in analysis and forecasting of flow-of-funds accounts, the federal budget and Federal Reserve operations. At Nomura Securities, among other duties, she developed various indicator forecasting tools and edited a daily global publication produced in London and New York for readers in Tokyo. At Haver Analytics, Carol was a member of the Research Department, aiding database managers with research and documentation efforts, as well as posting commentary on select economic reports. In addition, she conducted Ways-of-the-World, a blog on economic issues for an Episcopal-Church-affiliated website, The Geranium Farm. During her career, Carol served as an officer of the Money Marketeers and the Downtown Economists Club. She had a PhD from NYU's Stern School of Business. She lived in Brooklyn, New York, and had a weekend home on Long Island.
More Economy in Brief
 Global| Feb 05 2026
Charts of the Week: Balanced Policy, Resilient Data and AI Narratives
by:Andrew Cates


