 Global| Aug 15 2006
Turkey's Leading Composite Indicators and Business Confidence: Harbingers of Lower Growth?
Summary
The Composite Leading Indicator (MBONCUE-SUE) in Turkey is casting some doubt on the continuance of the period of good economic growth and relatively low inflation that the country has experience over the past few years. As can be [...]

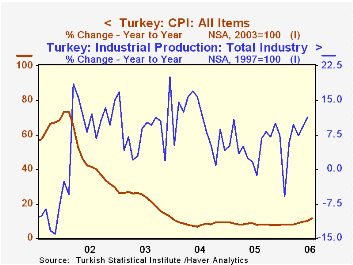
The Composite Leading Indicator (MBONCUE-SUE) in Turkey is casting some doubt on the continuance of the period of good economic growth and relatively low inflation that the country has experience over the past few years. As can be seen in the first chart the year over year growth in industrial production has ranged between 5% and 9% while the year over year increase in consumer prices has declined from around 22% in 2003 to 8.6% in 2004 and 8.2% in 2005.
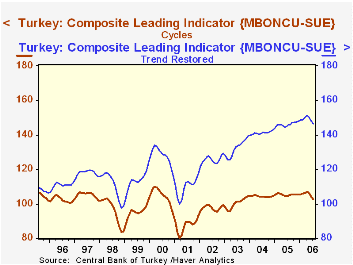
Turkey's composite leading indicator is expressed in three differ forms: (1) Trend Restored (2) Cycle and (3) a six month moving average. All three forms have declined in June and July and, except for Trend Restored, they are below July, 2005 and the Trend Restored form is only 0.51% above July, 2005. The second chart shows the Trend Restored and Cycle. The six-month rate of change shows a similar trend.
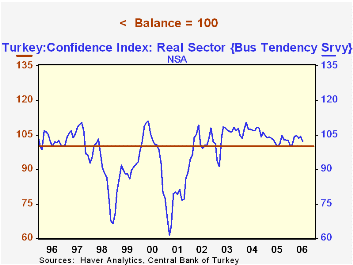
The Business Tendency Survey increased in June but has declined in July from 104.4 to 102.4. This measure is so designed that values above 100 represent a preponderance of optimists, values below 100, a preponderance of pessimists and a value of 100, balance between optimists and pessimists. Although the current value is 2.4 points above 100, indicating a preponderance of optimists, it is well below the recent peak of 110.3 in February, 2004.
| Turkey | Jul 06 | Jun 06 | Jul 05 | M/M % | Y/Y % | 2005 | 2004 | 2003 |
|---|---|---|---|---|---|---|---|---|
| Composite Leading Indicator | ||||||||
| Trend Restored | 146.25 | 148.02 | 145.51 | -1.20 | 0.51 | 146.13 | 141.15 | 132.27 |
| Cycle | 102.79 | 105.25 | 104.86 | -1.40 | -1.97 | 105.41 | 144.40 | 100.30 |
| Six-month Rate of Change | -2.43 | 0.09 | 2.49 | -2.52* | -4.92* | 3.52 | 5.14 | 6.81 |
| Business Tendency Survey | ||||||||
| Confidence Index (100=Balance , >100=Optimistic, <100=Pessimistic |
102.4 | 104.4 | 103.5 | -2.20 | 2.10 | 122.8 | 106.8 | 104.1 |
More Economy in Brief
 Global| Feb 05 2026
Charts of the Week: Balanced Policy, Resilient Data and AI Narratives
by:Andrew Cates


