 Global| Jan 08 2008
U.K. House Prices: Halifax Bank of Scotland (HBOS) Indexes and Averages of House Prices
Summary
The seasonally adjusted Halifax Bank of Scotland's Index of house prices showed a slight rise in the price of houses in the United Kingdom in December after declines in the three previous months. The Index rose 1.3% from 629.5 [...]


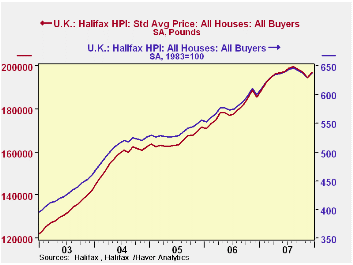
The seasonally adjusted Halifax Bank of Scotland's Index of house prices showed a slight rise in the price of houses in the United Kingdom in December after declines in the three previous months. The Index rose 1.3% from 629.5 (1983=100) November to 637.7 in December. The Bank also publishes data on the pound price of a house. In December the price rose to 197,039 pounds from 194.500 in November. The average price of all houses in the U.K. in index and pound terms is shown in the first chart.
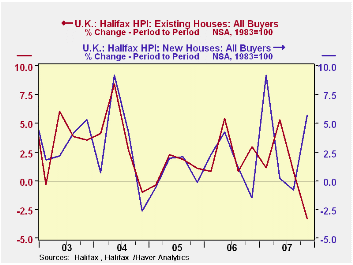
Seasonal adjustment has only been applied to the price of all houses. Prices paid for new and existing house and prices paid by first time buyers and former owner occupiers are available only on an unadjusted bases. In order to reduce some of the noise in the data we have aggregated the data from monthly to quarterly. In spite of the rise in house prices in December, the fourth quarter showed a decline of 2.4% in the unadjusted data of total sales. The prices of existing houses, however, declined 3.3% and the price of new houses rose by 5.7%, as shown in the second chart.
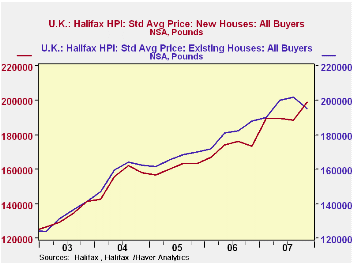
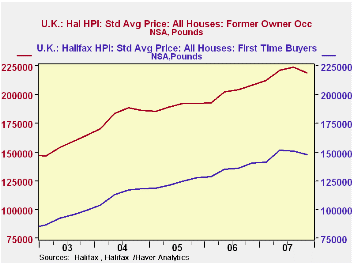
The average price paid for a new house in the last quarter of 2007 was 199 thousand pounds or almost 6% above the third quarter, while the price of an existing house was 195 thousand pounds or 3.3% below the third quarter. Prices paid for new and existing houses are shown in the third chart. Both the first time buyer and the former owner occupier paid 2% less on average for a house in the fourth quarter than in the third quarter. However the first time payer paid an average of 147 thousand pounds while a former owner occupier paid an average of 219 thousand pounds as shown in the fourth chart.


| U. K. HOUSE PRICES:HALIFAX BANK OF SCOTLAND | Dec 07 | Nov 07 | Dec 06 | M/M % Chg |
Y/Y % Chg |
2006 | 2005 | 2004 |
|---|---|---|---|---|---|---|---|---|
| Index 1983=100 | ||||||||
| All Houses SA | 637.7 | 629.5 | 599.7 | 1.30 | 6.34 | 634.3 | 580.1 | 535.0 |
| All Houses NSA | 632.2 | 628.7 | 594.4 | 0.56 | 6.36 | 634.3 | 580.1 | 535.0 |
| Existing Houses NSA | 641.0 | 635.6 | 612.5 | 0.85 | 4.65 | 648.4 | 595.6 | 548.7 |
| Newly Built NSA | 547.5 | 582.2 | 497.5 | -5.96 | 10.05 | 550.8 | 496.4 | 462.7 |
| Standard Average Price (Pounds) SA | 197039 | 194500 | 185280 | 1.31 | 6.35 | 195973 | 179233 | 165310 |
| Q4 07 | Q3 07 | Q4 06 | Q/Q %Chg |
Y/Y %Chg |
2006 | 2005 | 2004 | |
| All Houses SA | 634.7 | 643.9 | 602.8 | -1.39 | 5.33 | 634.3 | 580.1 | 535.0 |
| All Houses NSA | 633.7 | 649.3 | 601.2 | -2.40 | 5.40 | 634.3 | 580.1 | 535.0 |
| Existing Houses NSA | 643.0 | 664.9 | 619.0 | -3.30 | 3.87 | 648.4 | 595.6 | 548.7 |
| Newly Built NSA | 572.0 | 541.2 | 498.6 | 5.70 | 14.72 | 550.8 | 496.4 | 462.7 |
More Economy in Brief
 Global| Feb 05 2026
Charts of the Week: Balanced Policy, Resilient Data and AI Narratives
by:Andrew Cates


