 Global| May 03 2006
U.S. Auto Sales Up, Light Truck Sales Down
by:Tom Moeller
|in:Economy in Brief
Summary
US light vehicle sales rose a slight 0.9% during April to 16.74M units according to the Autodata Corporation. The sales level matched Consensus expectations. The rough month-to-month stability of the total, however, masked divergent [...]
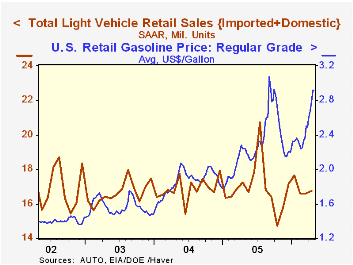
US light vehicle sales rose a slight 0.9% during April to 16.74M units according to the Autodata Corporation. The sales level matched Consensus expectations.
The rough month-to-month stability of the total, however, masked divergent underlying patterns. 
Perhaps reflecting the effects of higher fuel costs, sales of domestic trucks fell a sharp 6.6% (-9.3% y/y) and that decline pulled overall light truck sales down 4.8% (-6.1% y/y) last month. Sales of the relatively fuel efficient imported light trucks, in contrast, rose 5.6% (15.0% y/y).
Auto sales during April rose 7.8% (0.8% y/y) led by an 11.3% jump in imported car sales (12.3% y/y) to 2.58M units, the highest level since early 1990. Sales of domestic autos also improved 6.3% (-3.8% y/y).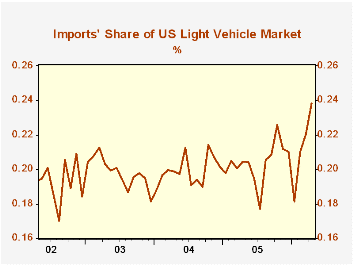
Imports' share of the US light vehicle market surged to another record level, at 23.8%. For the first four months of 2006 imports' share averaged 21.2% versus 20.3% during all of last year.
Inventories of domestically made autos fell 10.2% y/y through February while truck inventories, domestics & imports, through March were off 2.7% y/y.
Production of autos was up 14.5% through March though the GDP estimate of total real motor vehicle output through 1Q was down 2.5% y/y.
The U.S. auto supplier industry in transition from the Federal Reserve Bank of Chicago is available here.
| Light Vehicle Sales (SAAR, Mil. Units) | April | Mar | Y/Y | 2005 | 2004 | 2003 |
|---|---|---|---|---|---|---|
| Total | 16.74 | 16.59 | -2.9% | 16.92 | 16.87 | 16.63 |
| Autos | 8.00 | 7.42 | 0.8% | 7.65 | 7.49 | 7.62 |
| Trucks | 8.74 | 9.17 | -6.1% | 9.27 | 9.37 | 9.01 |
by Tom Moeller May 3, 2006
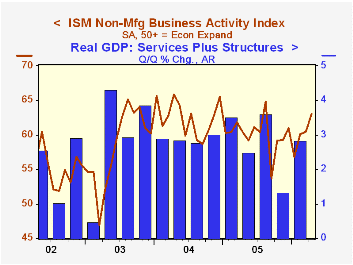
In April, the Business Activity Index for the non-manufacturing sector rose a convincing two and one half points to the highest level since August, reported the Institute for Supply Management (ISM). The rise to 63.0 by far outpaced Consensus expectations for a decline to 59.5.
Since the series' inception in 1997 there has been a 50% correlation between the level of the Business Activity Index and the q/q change in real GDP for services plus construction.
The new orders index jumped five points to 64.6, the highest level since 2004 while the employment index recouped about half of the prior month's decline with a rise to 56.5 and was up from the 2005 average of 55.9. Since the series' inception in 1997 there has been a 60% correlation between the level of the ISM non-manufacturing employment index and the m/m change in payroll employment in the service producing plus the construction industries.
Pricing power recovered all of the March decline and rose ten points to the highest level since November. Since inception eight years ago, there has been a 70% correlation between the price index and the y/y change in the GDP services chain price index.
ISM surveys more than 370 purchasing managers in more than 62 industries including construction, law firms, hospitals, government and retailers. The non-manufacturing survey dates only to July 1997, therefore its seasonal adjustment should be viewed tentatively.Business Activity Index for the non-manufacturing sector reflects a question separate from the subgroups mentioned above. In contrast, the NAPM manufacturing sector composite index is a weighted average five components.
| ISM Nonmanufacturing Survey | April | Mar | April '05 | 2005 | 2004 | 2003 |
|---|---|---|---|---|---|---|
| Business Activity Index | 63.0 | 60.5 | 60.4 | 60.1 | 62.5 | 58.3 |
| Prices Index | 70.5 | 60.5 | 64.1 | 67.9 | 68.8 | 56.6 |
by Tom Moeller May 3, 2006
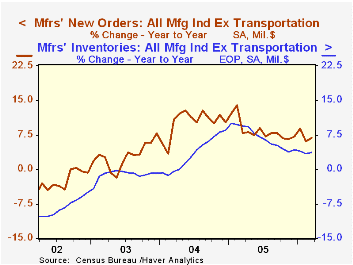
Factory inventories rose 0.7% during March and more than made up for an unrevised 0.4% drop the prior month.
Much of the prior month's inventory decline had been due to lower computers & electronic products which fully recovered with a 2.9% (4.1% y/y) rise. Machinery inventories also were down in February and then rose in March by 1.0% (6.0% y/y) while a 0.2% decline in electrical equipment inventories (6.1% y/y) also fully reversed.
Continuing with earlier accumulation, inventories of furniture & related products jumped 1.9% (5.5% y/y) while primary metals inventories added 0.2% (0.5% y/y) to the very strong accumulation of January & February.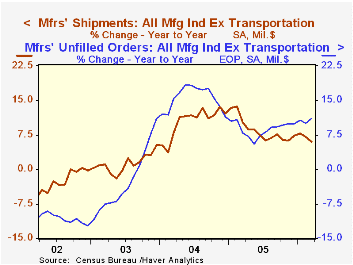
Total factory orders jumped 4.2% due to a 6.5% surge in durable goods orders, revised up from the advance report of a 6.1% surge. That was goosed by orders for nondefense aircraft & parts which rose 71.3% (329.9% y/y). Factory orders less the transportation sector altogether rose 2.2% (6.8% y/y) and reversed all of the prior month's decline.
Factory shipments rose 0.8% and reversed most of a February drop while less transportation shipments gained back half of the February drop with a 0.8% increase (6.0% y/y). Petroleum shipments rose 7.8% (7.3% y/y). Factory shipments less transportation & petroleum ticked up 0.1% (5.9% y/y).
Unfilled orders ballooned 2.9% due to the strength of aircraft orders. Nevertheless, less the transportation sector altogether backlogs rose 1.5% (11.1% y/y).
| Factory Survey (NAICS) | Mar | Feb | Y/Y | 2005 | 2004 | 2003 |
|---|---|---|---|---|---|---|
| Inventories | 0.7% | -0.4% | 3.4% | 4.4% | 7.7% | -1.1% |
| New Orders | 4.2% | 0.4% | 11.6% | 8.5% | 9.3% | 3.5% |
| Shipments | 0.8% | -1.2% | 6.1% | 7.4% | 9.5% | 1.5% |
| Unfilled Orders | 2.9% | 1.1% | 21.1% | 16.5% | 8.4% | 8.0% |
by Carol Stone and Tom Moeller May 3, 2006
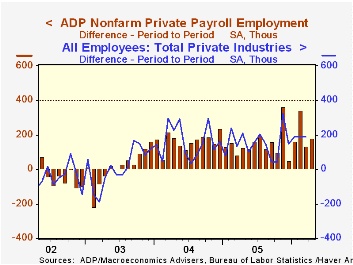
Today, ADP, the well-known payroll processors for many employers, published an estimate of the upcoming nonfarm payroll data for April, pointing to an increase in private sector employment of 178,000 for the month (1.9% y/y). They have compiled this from their substantial database of individual companies' payroll information. Macroeconomic Advisers, LLC, the St. Louis economic consulting firm, developed the methodology for transforming the raw data into an economic indicator meant to project the BLS's official number. This 178,000 gain would follow March's 133,000 rise.
These data are called the "ADP National Employment Report". The series will be maintained in Haver's USECON database; historical data go back to December 2000. Importantly, the figures in this report cover only private sector jobs and exclude employment in the public sector, which grew an average of 13,000 per month over the last year. The monthly change also obviously varies, and indeed ranged from a decline of 34,000 to an increase of 35,000. This would be a significant difference between the ADP number and total nonfarm payrolls. Some analysts indicated that ADP's April estimate of 178,000 in private sector jobs would correspond to a gain in total payrolls of 200,000.
Unlike other indicators of the US labor market, such as unemployment insurance claims, the ADP measure is directly comparable to the kind of data in the official BLS report. Automatic Data Processing, Inc. is the nation's leading provider of payroll-related services. Their figure is based on information about 24,000,000 jobholders; this is distilled to cover the numbers actually on payrolls during the BLS survey week, about 14,000,000. The report will be issued at 8:15AM on the Wednesday prior to each employment release.
According to ADP and Macro Advisers, the correlation between the monthly percentage change in the ADP estimate and that in the BLS data is 0.90. The estimator is shown by the firms' analysis to outperform current "consensus" forecasts and models based on claims data.
The full ADP National Employment Report can be found here, and their methodology is explained here.
| LAXEPA@USECON | April | Mar | Y/Y | 2005 | 2004 | 2003 |
|---|---|---|---|---|---|---|
| Nonfarm Private Payroll Employment (Chg.) | 178,000 | 133,000 | 1.9% | 1.7% | 1.3% | -0.4% |

Tom Moeller
AuthorMore in Author Profile »Prior to joining Haver Analytics in 2000, Mr. Moeller worked as the Economist at Chancellor Capital Management from 1985 to 1999. There, he developed comprehensive economic forecasts and interpreted economic data for equity and fixed income portfolio managers. Also at Chancellor, Mr. Moeller worked as an equity analyst and was responsible for researching and rating companies in the economically sensitive automobile and housing industries for investment in Chancellor’s equity portfolio. Prior to joining Chancellor, Mr. Moeller was an Economist at Citibank from 1979 to 1984. He also analyzed pricing behavior in the metals industry for the Council on Wage and Price Stability in Washington, D.C. In 1999, Mr. Moeller received the award for most accurate forecast from the Forecasters' Club of New York. From 1990 to 1992 he was President of the New York Association for Business Economists. Mr. Moeller earned an M.B.A. in Finance from Fordham University, where he graduated in 1987. He holds a Bachelor of Arts in Economics from George Washington University.
More Economy in Brief


