 Global| Aug 13 2015
U.S. Business Inventories Grow, as Sales Gains Are Modest
Summary
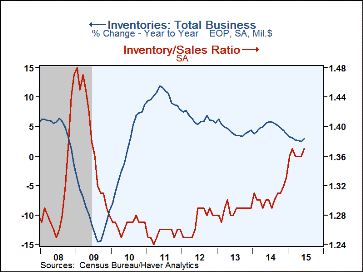
Total business inventories expanded 0.8% in June (3.0% y/y) after May's more moderate 0.3% increase, which was unrevised. The resulting 3-month growth climbed to 6.0% (AR) from May's 3.3%. This is less favorable than it might seem on [...]
Total business inventories expanded 0.8% in June (3.0% y/y) after May's more moderate 0.3% increase, which was unrevised. The resulting 3-month growth climbed to 6.0% (AR) from May's 3.3%. This is less favorable than it might seem on at first glance, as it partially reflects slower growth in total business sales, which edged up 0.2% and were down 2.5% year-on-year; May's monthly gain was 0.4%, also unrevised. June's 3-month growth rate eased to 4.4% from May's 6.0%. With the slower sales growth, the overall inventory/sales ratio for June ticked up to 1.37 from the 1.36 that had held for three months in a row.
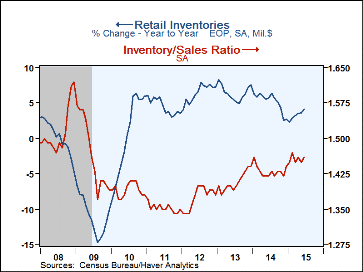
Retailers' inventories rose 0.9% in June (4.1% y/y), and May was revised to a rise of 0.2% from the unchanged reading reported before. The 3-month growth was thus 7.2% through June, up noticeably from May's 4.7%. General merchandise stores' inventories rose 0.6% (2.7% y/y) in June, the same as in May. Their 3-month growth jumped to 11.8%, exactly twice May's pace. Auto inventories are part of sluggish sales-higher inventory story in June, as a sales decline then of 1.5% was accompanied by an inventory gain of 1.4%; those inventories were thus up 5.9% y/y and their 3-month growth was 9.8%. But as Tom Moeller reports separately here today, auto dealer sales did recover in July. In June, clothing store inventories were up 0.5% (6.3% y/y) and 7.4% annualized over the last 3 months. Furniture store inventories rose 0.9% in June (-1.1% y/y) after May's 0.5% decline, putting a 3-month rate of decline at 3.2%. Inventories at building materials and garden supply stores rose 1.0% (5.4% y/y), with 3-month growth at 9.0%.
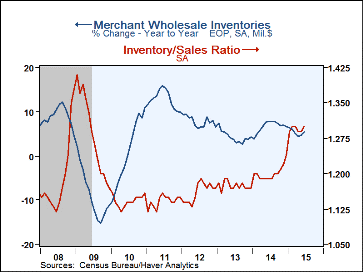
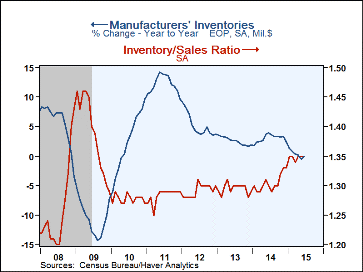
Merchant wholesalers' inventories were up 0.9% (5.4% y/y) in June. The 3-month growth rate advanced to 8.2% from May's 5.0%. Manufacturers' inventories rose 0.3% in June (-0.1% y/y), following May's 0.1% increase. Three-month growth picked up to 3.2% (AR) from May's modest 0.6% rate.
As noted above, total business sales increased just 0.2% in June (-2.5% y/y); the 3-month growth was 4.4%. Total sales included a decrease in retail sales 0.1% (+1.0% y/y) in June; July's sales then recovered, as reported separately today. Wholesale sales edged up 0.1% in June (-3.8% y/y), following May's 0.2% increase. The resulting 3-month growth was 8.3%, due to a 1.7% surge back in April. Factory shipments were up 0.5%% (-3.9% y/y) in June and grew at a 0.9% pace over the last 3 months.
The total business inventory-to-sales ratio increased to 1.37 in June, as noted above, from 1.36 in May. At retailers, the ratio was steady at May's 1.45. Wholesalers experienced an increase to 1.30 from 1.29 the previous two months, and manufacturers had a steady ratio at 1.35. For manufacturers and wholesalers, these ratios are distinctly higher than the entire post-recession period through the end of 2014, and for retailers these readings are modestly above those of the 2009-2014 span.
The manufacturing and trade data are in Haver's USECON database.
| Manufacturing & Trade (%) | June | May | Apr | June Y/Y | 2014 | 2013 | 2012 |
|---|---|---|---|---|---|---|---|
| Business Inventories | 0.8 | 0.3 | 0.4 | 3.0 | 3.8 | 4.4 | 5.7 |
| Retail | 0.9 | 0.2 | 0.6 | 4.1 | 2.7 | 7.6 | 7.3 |
| Retail excl. Motor Vehicles | 0.7 | 0.3 | 0.5 | 3.3 | 2.2 | 5.0 | 3.0 |
| Merchant Wholesalers | 0.9 | 0.6 | 0.4 | 5.4 | 6.7 | 4.2 | 6.6 |
| Manufacturing | 0.6 | 0.1 | 0.2 | -0.1 | 2.4 | 1.9 | 3.8 |
| Business Sales (%) | |||||||
| Total | 0.2 | 0.4 | 0.5 | -2.5 | 3.4 | 3.0 | 5.0 |
| Retail | -0.1 | 1.3 | -0.1 | 1.0 | 3.6 | 3.9 | 4.8 |
| Retail excl. Motor Vehicles | 0.4 | 1.1 | -0.3 | -0.4 | 2.5 | 2.7 | 3.8 |
| Merchant Wholesalers | 0.1 | 0.2 | 1.7 | -3.8 | 4.3 | 3.1 | 5.9 |
| Manufacturing | 0.5 | -0.2 | -0.0 | -3.9 | 2.5 | 2.1 | 4.4 |
| I/S Ratio | |||||||
| Total | 1.37 | 1.36 | 1.36 | 1.30 | 1.31 | 1.29 | 1.27 |
| Retail | 1.45 | 1.45 | 1.46 | 1.42 | 1.43 | 1.41 | 1.38 |
| Retail Excl. Motor Vehicles | 1.27 | 1.27 | 1.28 | 1.23 | 1.24 | 1.23 | 1.21 |
| Merchant Wholesalers | 1.30 | 1.29 | 1.29 | 1.19 | 1.20 | 1.18 | 1.16 |
| Manufacturing | 1.35 | 1.35 | 1.35 | 1.30 | 1.31 | 1.30 | 1.29 |
Carol Stone, CBE
AuthorMore in Author Profile »Carol Stone, CBE came to Haver Analytics in 2003 following more than 35 years as a financial market economist at major Wall Street financial institutions, most especially Merrill Lynch and Nomura Securities. She had broad experience in analysis and forecasting of flow-of-funds accounts, the federal budget and Federal Reserve operations. At Nomura Securities, among other duties, she developed various indicator forecasting tools and edited a daily global publication produced in London and New York for readers in Tokyo. At Haver Analytics, Carol was a member of the Research Department, aiding database managers with research and documentation efforts, as well as posting commentary on select economic reports. In addition, she conducted Ways-of-the-World, a blog on economic issues for an Episcopal-Church-affiliated website, The Geranium Farm. During her career, Carol served as an officer of the Money Marketeers and the Downtown Economists Club. She had a PhD from NYU's Stern School of Business. She lived in Brooklyn, New York, and had a weekend home on Long Island.
More Economy in Brief
 Global| Feb 05 2026
Charts of the Week: Balanced Policy, Resilient Data and AI Narratives
by:Andrew Cates


