 Global| Sep 15 2015
U.S. Business Inventory Total Rises Marginally; Mixed by Sector
Summary
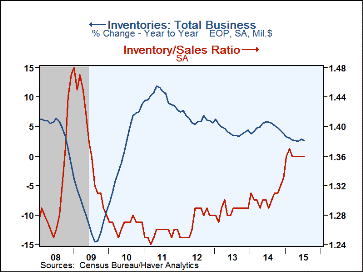
Total business inventories edged up 0.1% in July (2.6% y/y) after a 0.7% advance in June, revised slightly from 0.8% reported initially. The resulting 3-month growth was 3.0% (AR), down from 5.0% in June. Total business sales also [...]
Total business inventories edged up 0.1% in July (2.6% y/y) after a 0.7% advance in June, revised slightly from 0.8% reported initially. The resulting 3-month growth was 3.0% (AR), down from 5.0% in June. Total business sales also increased 0.1% in July (-2.7% y/y), less than June's 0.3%, which was revised from 0.2% reported before. July's 3-month growth rate was 3.1%, compared to 5.0% in June. The overall inventory/sales ratio was 1.36 in July, the same as in June, which was revised down from 1.37.
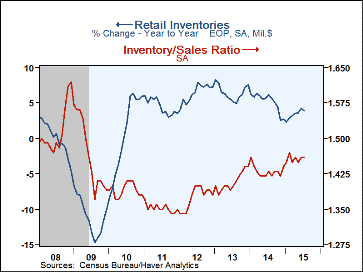
Retailers' inventories increased 0.6% in July (3.9% y/y), and June was revised to 1.0% from 0.9%. The 3-month growth was 7.7% through July, marginally larger than June's 7.6%. Total retail excluding motor vehicles saw inventories up 0.2% in July (3.2% y/y), less than June's 0.7%, which was unrevised. The 3-month increase was 5.2% through July, down from 6.1% in June. Motor vehicle dealer inventories rose 1.4% in July (12.8% y/y) after 1.6% in June; their 3-month growth was 12.8% (AR) through July, up from June's 10.6%. General merchandise stores' inventories slowed to a 0.1% rise in July (2.6% y/y) from 0.8% in June. Their 3-month growth was 6.1%, then, down from June's 12.6% pace. Clothing store inventories fell 0.2% in July (5.4% y/y) following a 0.1% uptick in June; their 3-month growth thus slowed to 3.3% from 5.8%. Furniture store inventories slowed to a 0.2% rise (-0.8% y/y) from 0.9% in June; their 3-month growth rate was 2.1%, though, reversing the -3.2% in June. Inventories at building materials and garden supply stores rose 0.6% (5.6% y/y), with 3-month growth at 9.1%.
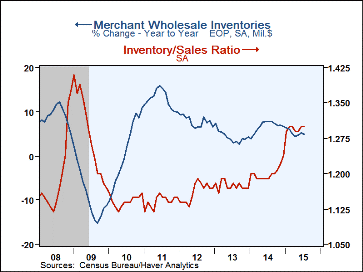
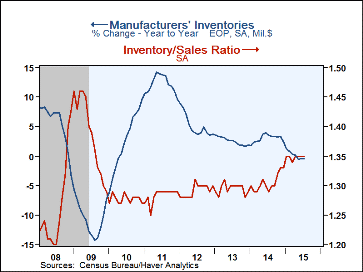
Merchant wholesalers' inventories edged down 0.1% in July (4.9% y/y) after June's 0.7% increase. Their 3-month growth was 5.1% in July following 7.4% in June. At manufacturers, inventories also fell 0.1% in July (-0.4% y/y), following 0.3% in June; that gave a 1.0% rate of growth over the last 3 months.
As noted above, total business sales also rose 0.1% in July, the same growth as in inventories; they had increased 0.3% in June and their 3-month growth through July was 3.1%. Retail sales (excluding food services) advanced 0.8% in July after falling 0.1% in June; their 3-month growth in July was 8.2%, although, as indicated by Tom Moeller's accompanying report here, they slowed again in August. Merchant wholesalers' sales turned down in July by 0.3% (-4.2% y/y) after a 0.4% rise in June; their 3-month growth thus was a mere 0.9%. Manufacturers' shipments decreased 0.2% (-4.9% y/y) following a 0.6% rise in June; that put their 3-month growth at a 1.1% pace.
The total business inventory-to-sales ratio was 1.36 in July, as noted above, the same as in June, which was revised from 1.37. For retailers, the ratio was 1.46 in July, also the same as in June, which was revised from 1.45. Wholesalers' I/S ratio was flat at 1.30 and manufacturers' at 1.35. For manufacturers and wholesalers, these ratios are distinctly higher than the entire post-recession period through the end of 2014, and for retailers these readings are modestly above those of the 2009-2014 span.
The manufacturing and trade data are in Haver's USECON database.
| Manufacturing & Trade (%) | July | June | May | July Y/Y | 2014 | 2013 | 2012 |
|---|---|---|---|---|---|---|---|
| Business Inventories | 0.1 | 0.7 | 0.3 | 2.6 | 3.8 | 4.4 | 5.7 |
| Retail | 0.6 | 1.0 | 0.2 | 3.9 | 2.7 | 7.6 | 7.3 |
| Retail excl. Motor Vehicles | 0.2 | 0.7 | 0.3 | 3.2 | 2.2 | 5.0 | 3.0 |
| Merchant Wholesalers | -0.1 | 0.7 | 0.6 | 4.9 | 6.7 | 4.2 | 6.6 |
| Manufacturing | -0.1 | 0.3 | 0.1 | -0.4 | 2.4 | 1.9 | 3.8 |
| Business Sales (%) | |||||||
| Total | 0.1 | 0.3 | 0.4 | -2.7 | 3.4 | 3.0 | 5.0 |
| Retail | 0.8 | -0.1 | 1.3 | 1.9 | 3.6 | 3.9 | 4.8 |
| Retail excl. Motor Vehicles | 0.6 | 0.4 | 1.1 | 0.5 | 2.5 | 2.7 | 3.8 |
| Merchant Wholesalers | -0.3 | 0.4 | 0.2 | -4.2 | 4.3 | 3.1 | 5.9 |
| Manufacturing | -0.2 | 0.6 | -0.2 | -4.9 | 2.5 | 2.1 | 4.4 |
| I/S Ratio | |||||||
| Total | 1.36 | 1.36 | 1.36 | 1.29 | 1.31 | 1.29 | 1.27 |
| Retail | 1.46 | 1.46 | 1.45 | 1.43 | 1.43 | 1.41 | 1.38 |
| Retail Excl. Motor Vehicles | 1.27 | 1.27 | 1.27 | 1.23 | 1.24 | 1.23 | 1.21 |
| Merchant Wholesalers | 1.30 | 1.30 | 1.29 | 1.19 | 1.20 | 1.18 | 1.16 |
| Manufacturing | 1.35 | 1.35 | 1.35 | 1.29 | 1.31 | 1.30 | 1.29 |
Carol Stone, CBE
AuthorMore in Author Profile »Carol Stone, CBE came to Haver Analytics in 2003 following more than 35 years as a financial market economist at major Wall Street financial institutions, most especially Merrill Lynch and Nomura Securities. She has broad experience in analysis and forecasting of flow-of-funds accounts, the federal budget and Federal Reserve operations. At Nomura Securites, among other duties, she developed various indicator forecasting tools and edited a daily global publication produced in London and New York for readers in Tokyo. At Haver Analytics, Carol is a member of the Research Department, aiding database managers with research and documentation efforts, as well as posting commentary on select economic reports. In addition, she conducts Ways-of-the-World, a blog on economic issues for an Episcopal-Church-affiliated website, The Geranium Farm. During her career, Carol served as an officer of the Money Marketeers and the Downtown Economists Club. She has a PhD from NYU's Stern School of Business. She lives in Brooklyn, New York, and has a weekend home on Long Island.


