 Global| Oct 30 2007
U.S. Chain Store Sales Sustain Lower Level, Gasoline Prices Up Again
by:Tom Moeller
|in:Economy in Brief
Summary
The International Council of Shopping Centers (ICSC)-UBS reported that chain store sales held steady last week (2.5% y/y) after a 1.5% decline during the week prior. The average level of store sales in October is down 0.8% from the [...]
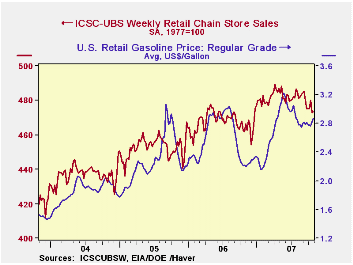
The International Council of Shopping Centers (ICSC)-UBS reported that chain store sales held steady last week (2.5% y/y) after a 1.5% decline during the week prior.
The average level of store sales in October is down 0.8% from the September average. That follows a 0.8% decline in the average level of chain store sales during September versus the August average.During the last ten years there has been a 45% correlation between the y/y change in chain store sales and the change in nonauto retail sales less gasoline.
The ICSC-UBS retail chain-store sales index is constructed using the same-store sales (stores open for one year) reported by 78 stores of seven retailers: Dayton Hudson, Federated, Kmart, May, J.C. Penney, Sears and Wal-Mart.The leading indicator of chain store sales from ICSC-UBS fell 0.2% (-0.7% y/y) after a 0.2% decline during the prior week.
The decline in chain store sales accompanied a another nickel rise in average gasoline prices across the country to $2.87 (27.9% y/y) per gallon.Higher gasoline prices followed the 4.7% m/m increase in crude oil prices so far in October to $83.47 per barrel. That rise since has backed off slightly from the daily high this month of $89.48 per barrel but only to $87.57.
| ICSC-UBS (SA, 1977=100) | 10/27/07 | 10/20/07 | Y/Y | 2006 | 2005 | 2004 |
|---|---|---|---|---|---|---|
| Total Weekly Chain Store Sales | 473.3 | 472.9 | 2.5% | 3.3% | 3.6% | 4.7% |
by Tom Moeller October 30, 2007
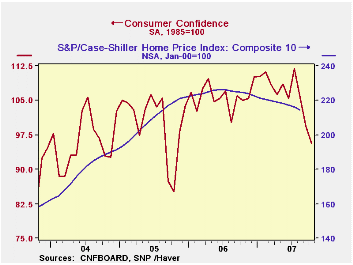
Consumer confidence fell in October according to the Conference Board Survey. The 3.9% m/m decline was preceded by declines of 5.8% and 5.6% during the prior two months.
The decline in the index to 95.6, in fact, was to the lowest level since October 2005. Economists generally had expected a lesser decline to 99.0.
The present conditions fell 2.0% after declines of 6.8% and 5.9% during the prior two months. The decline also was to the lowest level in about two years.
The percentage of respondents who viewed business conditions as good dropped sharply for the third consecutive month while the percentage who viewed jobs as plentiful also fell hard for the third month. Those who felt jobs were hard to get rose to the highest since late 2005.
The expectations index similarly fell sharply by 5.8% m/m to the lowest in two years. Expectations about business conditions and income both fell but expectations about employment rose slightly. 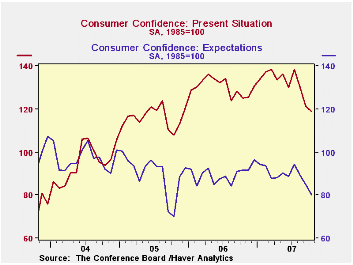
Plans to buy major appliances fell most sharply to the lowest in two years while plans to buy carpet held steady at a low level. The percentage of respondents who would buy a new car fell to the lowest since July.
The expected inflation rate in twelve months remained at 5.1%, equal to expectations during all of last year for inflation in twelve months.
U.S. home prices fell 0.8% m/m in August for the 14th consecutive month, according to the S&P/Case-Shiller home price index composite 10.
The index of just 10 U.S. cities and their surrounding areas is not adjusted for the quality or the size of the home. It fell five percent in August from a year ago.
| Conference Board (SA, 1985=100) |
October | September | Y/Y | 2006 | 2005 | 2004 |
|---|---|---|---|---|---|---|
| Consumer Confidence Index | 95.6 | 99.5 | -9.0% | 105.9 | 100.3 | 96.1 |
| Present Conditions | 118.8 | 121.2 | -5.0% | 130.2 | 116.1 | 94.9 |
| Expectations | 80.1 | 85.0 | -12.8% | 89.7 | 89.7 | 96.9 |
by By Robert Brusca October 30, 2007
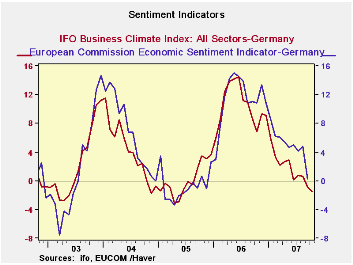
The IFO indexes from Germany provide us with detail to their
earlier
release. The chart on the left shows that the EU indexes for Germany’s
MFG sector track the result for the IFO. Both indexes are pointing
lower with the IFO index more up-to-date. The climate gauge is closing
in on a level that is near its position when Germany’s economy was
still struggling with EU debt limits and growth before the recent run
up in growth and optimism came to pass. The table below documents some
of the more worrisome elements of the new IFO survey
The percentile column (the last column) and red highlights
provide
the best overview for this table. While the strong and rising euro
seems to be one of the main risk factors to German growth, foreign
orders on hand continue to be buoyant (last listing in the table).
Foreign orders on hand rank high in terms of the individual sector
percentile readings. The foreign order series is just beginning to show
decline in its monthly measures (not encroaching red highlights)
whereas the more inclusive ‘orders on hand’ category has been dropping
for some time and shows percentile ranks for current readings that are
at or below the midpoint mark except for capital goods. We know that
capital goods is one area of strength for Germany That may be one of
the reason its export demand or orders are holding up better that
orders in general. But that is not all of it since all export orders
are holding up better than orders in general. With the euro so strong
that has to be viewed as a curiosity. Even though many German ‘foreign’
orders do not cross the exchange market at some point they are still
exports and subject to competition from weak currencies.
Capital goods also tend to work on longer lags and the longer the Euro remains high the greater the prospect for Germany to lose orders to capital goods competitors like Japan and the US even though it does not appear to have happened yet.
Percentiles for activity measures also have slipped to mid range or weaker except for capital goods. Despite this, expectations for the next six months are generally upbeat even for consumer goods. The percentile readings are generally around the 60% mark or higher with a few exceptions. As for current conditions, the percentile sector readings are solid to strong.
Today’s German survey on consumer optimism, a poll by the Forsa institute, was commissioned by Germany's RTL television. It was carried out among 2,503 respondents from October 22 to 26. Some 43% of those surveyed said they expected the state of the economy to worsen, up from 28% in the previous Forsa survey conducted in May. Only 26% in the current survey said they expected the economy to pick up further, down from 41% in the May survey. Clearly, conditions and expectations are in flux in Germany. The IFO components are only beginning to show some of the ill effects of these shifts. The optimism of past success seems to weigh heavily on new assessments for the future among the IFO respondents.
| IFO Survey: Germany | |||||||||
|---|---|---|---|---|---|---|---|---|---|
| Percent: Yr/Yr | Index Numbers | ||||||||
| Oct 07 |
Sep 07 |
Aug 07 |
Jul 07 |
Jun 07 |
Current | Average | Curr/ Avg |
%tile | |
| Biz Climate | -1.5% | -0.9% | 0.7% | 0.8% | 0.2% | 103.9 | 95.7 | 108.5% | 79.7% |
| Current Situation | -2.1% | -1.3% | 2.5% | 2.4% | 1.6% | 109.6 | 94.8 | 115.6% | 82.3% |
| Biz Expectations | -0.7% | -0.4% | -1.1% | -0.9% | -1.2% | 98.6 | 96.7 | 102.0% | 68.6% |
| Oct 07 |
Sep 07 |
Aug 07 |
Jul 07 |
Jun 07 |
Current | Average | Curr/ Avg |
%tile | |
| Biz Climate | -1.5% | -0.9% | 0.7% | 0.8% | 0.2% | 103.9 | 95.7 | 108.5% | 79.7% |
| Current Situation | -2.1% | -1.3% | 2.5% | 2.4% | 1.6% | 109.6 | 94.8 | 115.6% | 82.3% |
| MFG | 0.0% | 0.8% | 4.4% | 4.4% | 4.4% | 109.5 | 92.4 | 118.5% | 90.8% |
| Intermediate | -1.6% | -0.5% | 3.1% | 3.0% | 4.3% | 109.0 | 91.0 | 119.8% | 86.6% |
| Capital | 2.9% | -0.4% | 5.5% | 4.8% | 5.1% | 113.1 | 92.1 | 122.7% | 97.1% |
| Consumer | 1.0% | 4.3% | 5.4% | 5.3% | 5.3% | 105.5 | 95.9 | 110.0% | 81.3% |
| Construction | -5.9% | -6.0% | -2.2% | -3.1% | -4.0% | 112.3 | 103.0 | 109.0% | 64.0% |
| Wholesale | -5.9% | -2.2% | -1.9% | -0.8% | 0.0% | 114.4 | 99.3 | 115.2% | 68.7% |
| Retail | -4.4% | -6.6% | 2.1% | 1.1% | -4.1% | 103.3 | 95.4 | 108.3% | 77.7% |
| Next 6 Mos | |||||||||
| Biz Expectations | Oct 07 |
Sep 07 |
Aug 07 |
Jul 07 |
Jun 07 |
Current | Average | Curr/ Avg |
%tile |
| MFG | -2.4% | -1.5% | -1.9% | -0.5% | -2.8% | 97.4 | 96.5 | 100.9% | 67.4% |
| Intermediate | -6.5% | -4.8% | -2.8% | -2.3% | -4.2% | 94.2 | 96.0 | 98.2% | 51.7% |
| Capital | 2.4% | 2.1% | -1.4% | 4.4% | -2.7% | 100.6 | 96.4 | 104.4% | 75.4% |
| Consumer | -0.5% | 1.0% | 0.5% | -2.3% | 0.9% | 99.1 | 97.8 | 101.3% | 62.6% |
| Construction | 3.4% | 3.4% | 0.1% | 0.2% | 0.4% | 101.3 | 98.2 | 103.1% | 57.4% |
| Wholesale | -3.4% | 3.5% | 0.5% | -3.8% | 2.8% | 101.3 | 97.0 | 104.4% | 63.5% |
| Retail | 5.5% | -3.0% | -0.5% | -0.5% | -0.5% | 98.4 | 96.0 | 102.5% | 70.1% |
| (m/m) | |||||||||
| Activty(m/m) | Oct 07 |
Sep 07 |
Aug 07 |
Jul -07 |
Jun 07 |
Current | Average | Curr/ Avg |
%tile |
| MFG | -5.3% | -4.5% | 1.0% | -1.8% | -3.6% | 96.9 | 97.0 | 99.9% | 52.9% |
| Intermediate | -8.6% | -5.8% | 0.5% | -5.9% | -4.6% | 93.2 | 96.3 | 96.8% | 42.4% |
| Capital | -3.3% | -2.3% | 0.0% | 0.5% | -2.7% | 99.0 | 97.1 | 102.0% | 63.8% |
| Consumer | -3.9% | -3.3% | 3.5% | -0.5% | -2.4% | 99.3 | 98.4 | 100.9% | 50.9% |
| Demand M/M | Oct 07 |
Sep 07 |
Aug 07 |
Jul 07 |
Jun 07 |
Current | Average | Curr/ Avg |
%tile |
| MFG | -8.4% | -6.4% | -2.8% | -3.3% | -7.1% | 95.3 | 97.1 | 98.2% | 48.5% |
| Intermediate | -13.8% | -9.2% | -3.8% | -6.8% | -10.3% | 91.5 | 97.5 | 93.8% | 33.0% |
| Capital | -3.7% | -4.2% | -1.9% | -3.2% | -4.9% | 98.8 | 96.0 | 102.9% | 72.5% |
| Consumer | -9.5% | -6.4% | -2.8% | 6.0% | -7.4% | 93.3 | 96.6 | 96.6% | 35.2% |
| Orders on hand | Oct 07 |
Sep 07 |
Aug 07 |
Jul 07 |
Jun 07 |
Current | Average | Curr/ Avg |
%tile |
| MFG | -7.9% | -4.6% | -2.3% | -2.7% | -3.6% | 97.4 | 96.5 | 101.0% | 55.7% |
| Intermediate | -13.3% | -9.6% | -5.2% | -8.4% | -6.7% | 93.5 | 96.5 | 96.8% | 39.9% |
| Capital | -1.8% | -0.9% | -0.5% | 1.0% | 0.8% | 101.5 | 95.7 | 106.1% | 77.1% |
| Consumer | -6.3% | -2.4% | 0.5% | 1.0% | -5.1% | 98.2 | 98.5 | 99.7% | 40.4% |
| Fgn orders on hand | Oct 07 |
Sep 07 |
Aug 07 |
Jul 07 |
Jun 07 |
Current | Average | Curr/ Avg |
%tile |
| MFG | -0.4% | 0.5% | 2.4% | 1.9% | 2.0% | 111.0 | 94.6 | 117.3% | 95.2% |
| Intermediate | -3.4% | -2.0% | 0.0% | -0.5% | 0.0% | 107.2 | 93.7 | 114.3% | 83.3% |
| Capital | 3.2% | 2.9% | 6.1% | 5.3% | 6.3% | 114.7 | 93.5 | 122.6% | 97.6% |
| Consumer | -0.4% | 2.1% | 1.6% | 0.0% | -0.5% | 112.2 | 98.5 | 113.9% | 93.7% |
| Yr/Yr percentage changes in underlying Indices | |||||||||
by Robert Brusca October 30, 2007
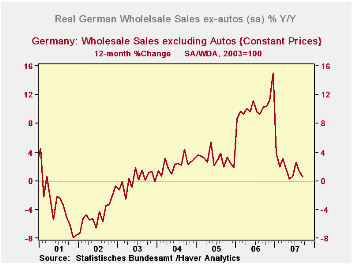
German real ex-auto wholesale sales fell by 0.3% in September after dropping by 0.8% in August. These declines blunted the sharp 1.3% gain in July that followed a rise of 0.6% in June. Around mid-year German wholesale sales seemed to be breaking out of their early in the year slump believed to have been induced by the turn-of-the year hike in the VAT. However, the past two months have discredited that view. Nonetheless, the mid-year strength was enough to boost real ex-auto wholesales sales to solid positive quarterly rate of growth. Real wholesale sales are up at a 3.3% annual rate in Q3 with nominal sales up at a pace of 3.9%. These readings are up from a year ago by 1.5% in real terms and by 1.8% in nominal terms. It is growth but is far from robust growth. And lest the quarterly result seem too strong recall that this rise in Q3 offsets a similar drop of 3% (annualized) in real ex-auto wholesale sales in Q2. The graph clearly shows no lasting boost to wholesale sales growth.
| Quarter Complete | |||
|---|---|---|---|
| Quarterly showing | |||
| % Q/Q | %-Saar | % Q/Yr Ago | |
| Nominal | 1.0% | 3.9% | 2.1% |
| Real | 0.8% | 3.3% | 1.5% |

Tom Moeller
AuthorMore in Author Profile »Prior to joining Haver Analytics in 2000, Mr. Moeller worked as the Economist at Chancellor Capital Management from 1985 to 1999. There, he developed comprehensive economic forecasts and interpreted economic data for equity and fixed income portfolio managers. Also at Chancellor, Mr. Moeller worked as an equity analyst and was responsible for researching and rating companies in the economically sensitive automobile and housing industries for investment in Chancellor’s equity portfolio. Prior to joining Chancellor, Mr. Moeller was an Economist at Citibank from 1979 to 1984. He also analyzed pricing behavior in the metals industry for the Council on Wage and Price Stability in Washington, D.C. In 1999, Mr. Moeller received the award for most accurate forecast from the Forecasters' Club of New York. From 1990 to 1992 he was President of the New York Association for Business Economists. Mr. Moeller earned an M.B.A. in Finance from Fordham University, where he graduated in 1987. He holds a Bachelor of Arts in Economics from George Washington University.
More Economy in Brief

 Global| Feb 05 2026
Charts of the Week: Balanced Policy, Resilient Data and AI Narratives
by:Andrew Cates

