 Global| Aug 22 2011
U.S. Chicago Fed Index Improves for July
Summary
The Chicago Fed's National Activity Index (CFNAI) remained negative in July, but it still improved noticeably from June's reading. The last couple of months were revised positively as well. These latest data relieved some of the [...]
 The Chicago Fed's National Activity Index (CFNAI) remained negative in July, but it still improved noticeably
from June's reading. The last couple of months were revised positively as well. These latest data relieved
some of the weakness in last month's report which had seemed ominous. The July index was a mere -0.06,
compared to June's -0.38, which was marginally better than the initial -0.46. May's -0.55 was lifted to -0.44.
These changes made the three-month moving average -0.29 for July, better than the -0.54 in June, which in turn was
improved from the -0.60 reported before.
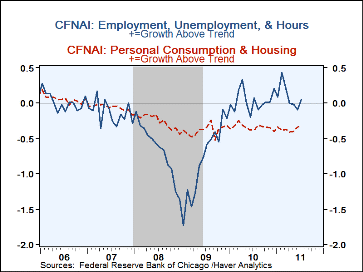
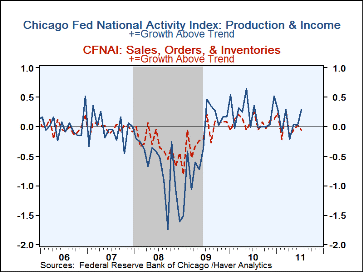
The index is a compilation of 85 basic gauges, such as industrial production of durable goods, nonfarm payrolls, real retail sales, housing starts and the inventory/sales ratio in manufacturing. Most enter as monthly changes, logs or log-changes. They are arrayed in four categories, production, employment & hours, consumption & housing and sales, orders & inventories. In July, the first three of these contributed to the index improvement; only the sales & inventories deteriorated. Moreover, the industrial production items and the employment items showed outright positive readings, not just smaller minuses. Individually, 43 of the 85 indicators made positive contributions and 42 were negative; 46 improved from June, 37 deteriorated and 2 were unchanged. Of the 46 that improved, 13 still had negative readings.
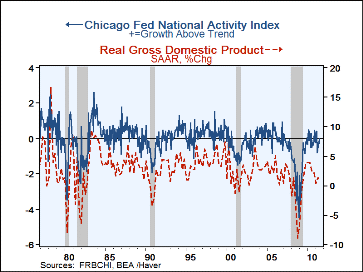
A reading for the CFNAI at or below -0.70 typically has indicated negative U.S. economic growth. A zero value of the index suggests that the economy is expanding at its historical trend rate of growth, a performance suggested by the July result at -0.06. During the last 35 years it's had a 78% correlation with the quarterly growth in real GDP. The Chicago Federal Reserve figures are available in Haver's SURVEYS database.
| Chicago Federal Reserve Bank | Jul | Jun | May | Jul'10 | 2010 | 2009 | 2008 |
|---|---|---|---|---|---|---|---|
| CFNAI | -0.06 | -0.38 | -0.44 | +0.27 | -0.03 | -1.63 | -1.94 |
| 3-Month Moving Average | -0.29 | -0.54 | -0.28 | 0.00 | -- | -- | -- |
| Personal Consumption & Housing | -0.33 | -0.34 | -0.40 | -0.38 | -0.34 | -0.38 | -0.26 |
| Employment, Unemployment & Hours | +0.05 | -0.10 | -0.02 | +0.07 | +0.03 | -0.81 | -0.67 |
| Production & Income | +0.28 | +0.03 | +0.04 | +0.36 | +0.22 | -0.27 | -0.70 |
| Sales, Orders & Inventories | -0.06 | +0.03 | -0.06 | +0.25 | +0.07 | -0.16 | -0.31 |
Carol Stone, CBE
AuthorMore in Author Profile »Carol Stone, CBE came to Haver Analytics in 2003 following more than 35 years as a financial market economist at major Wall Street financial institutions, most especially Merrill Lynch and Nomura Securities. She had broad experience in analysis and forecasting of flow-of-funds accounts, the federal budget and Federal Reserve operations. At Nomura Securities, among other duties, she developed various indicator forecasting tools and edited a daily global publication produced in London and New York for readers in Tokyo. At Haver Analytics, Carol was a member of the Research Department, aiding database managers with research and documentation efforts, as well as posting commentary on select economic reports. In addition, she conducted Ways-of-the-World, a blog on economic issues for an Episcopal-Church-affiliated website, The Geranium Farm. During her career, Carol served as an officer of the Money Marketeers and the Downtown Economists Club. She had a PhD from NYU's Stern School of Business. She lived in Brooklyn, New York, and had a weekend home on Long Island.


