 Global| Jul 12 2010
U.S. Commodity Prices Are Down But Not Out
by:Tom Moeller
|in:Economy in Brief
Summary
Commodity price figures probably are the most sensitive, high frequency economic indicators. What they show is that U.S. economic growth has lost forward momentum. The Commodity Research Bureau (CRB) index of spot prices is off [...]
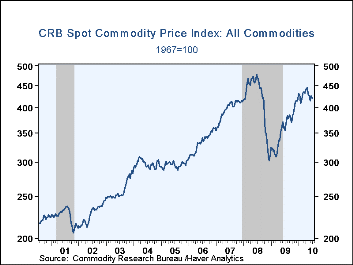
Commodity price figures probably are the most sensitive, high frequency economic indicators. What they show is that U.S. economic growth has lost forward momentum. The Commodity Research Bureau (CRB) index of spot prices is off roughly 6% from its April high. As an indicator of economic growth, notably in the factory sector, this suggests a growth slowdown following a strong winter. The move downward in prices is not, however, ongoing and the figures recently have moved sideways. Therefore, it's safe to conclude that a return to the recessionary environment of 2008-09 is not at hand.
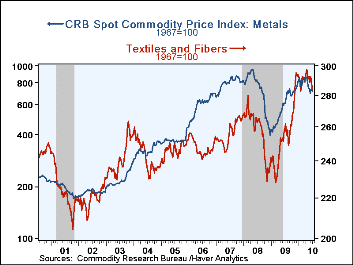
Metals prices clearly show the pattern of commodity prices overall. Aluminum, lead and zinc prices have been the weakest of the group. However, copper scrap and scrap steel prices have recovered after moderate declines in May and early-June. Textile prices recently moved to the low end of this year's range but have trended sideways since December.
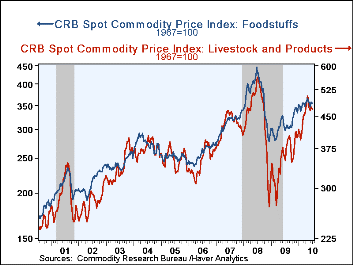
Food prices including butter, corn, soybean oil, sugar and wheat similarly have been firm, moving sideways since showing strength through early-May. That also has been the pattern for livestock & product prices. Conversely, and reflecting the ongoing weakness in housing, framing lumber prices have retraced all of a strong recovery earlier this year though these figures are not in the CRB measures.
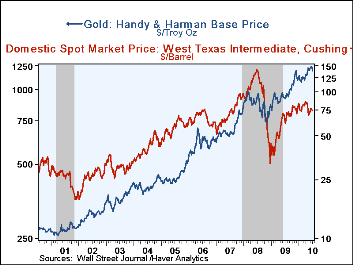
Though precious metals and oil prices also are not in the spot price measures, they too have stabilized after earlier strength. Gold prices jumped well above $1,200 an ounce in June but have backpedaled somewhat. Nevertheless, prices have risen nearly one-third during the last twelve months. Crude oil prices have shown the same pattern as gold. Currently near $75 per barrel, prices are down from their earlier high of $86 reached in April but remain up 17% during the last twelve months.
These commodity price data are available in Haver's WEEKLY database.
| Commodity Prices | 07/06/10 | 06/29/10 | December '09 | Y/Y | 2009 | 2008 | 2007 |
|---|---|---|---|---|---|---|---|
| CRB Spot Commodity Price Index: All Commodities | 421.0 | 418.9 | 416.6 | 18.9% | 421.5 | 312.2 | 415.0 |
| Metals | 721.2 | 721.3 | 765.3 | 18.9 | 804.1 | 392.9 | 818.8 |
| Textiles & Fibers | 282.6 | 284.4 | 293.5 | 9.2 | 293.6 | 239.9 | 266.1 |
| Raw Industrial Materials | 474.2 | 474.5 | 479.3 | 17.7 | 488.1 | 327.2 | 476.4 |
| Foodstuffs | 354.3 | 348.6 | 340.0 | 18.5 | 340.8 | 291.5 | 339.7 |
| Livestock & Products | 467.2 | 472.0 | 403.8 | 30.6 | 402.9 | 311.0 | 404.6 |
| Gold | 1,197.6 | 1,235.0 | 1,136.9 | 30.4 | 972.3 | 872.0 | 694.6 |
| Crude Oil,West Texas Intermediate | 74.96 | 77.10 | 73.70 | 8.1 | 61.95 | 99.67 | 72.30 |
Tom Moeller
AuthorMore in Author Profile »Prior to joining Haver Analytics in 2000, Mr. Moeller worked as the Economist at Chancellor Capital Management from 1985 to 1999. There, he developed comprehensive economic forecasts and interpreted economic data for equity and fixed income portfolio managers. Also at Chancellor, Mr. Moeller worked as an equity analyst and was responsible for researching and rating companies in the economically sensitive automobile and housing industries for investment in Chancellor’s equity portfolio. Prior to joining Chancellor, Mr. Moeller was an Economist at Citibank from 1979 to 1984. He also analyzed pricing behavior in the metals industry for the Council on Wage and Price Stability in Washington, D.C. In 1999, Mr. Moeller received the award for most accurate forecast from the Forecasters' Club of New York. From 1990 to 1992 he was President of the New York Association for Business Economists. Mr. Moeller earned an M.B.A. in Finance from Fordham University, where he graduated in 1987. He holds a Bachelor of Arts in Economics from George Washington University.
More Economy in Brief
 Global| Feb 05 2026
Charts of the Week: Balanced Policy, Resilient Data and AI Narratives
by:Andrew Cates


