 Global| Aug 01 2017
U.S. Construction Spending Activity Deteriorates
Summary
The value of construction put-in-place posted a surprisingly soft reading of -1.3% in June (+1.6% y/y), versus expectations (according to the Action Economics Forecast Survey) of a 0.4% increase. Revisions were mixed, with a slightly [...]
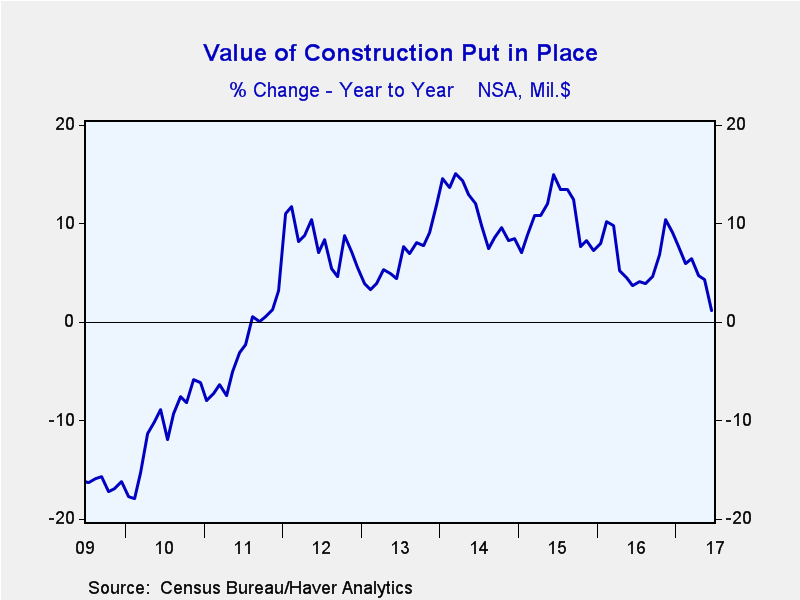
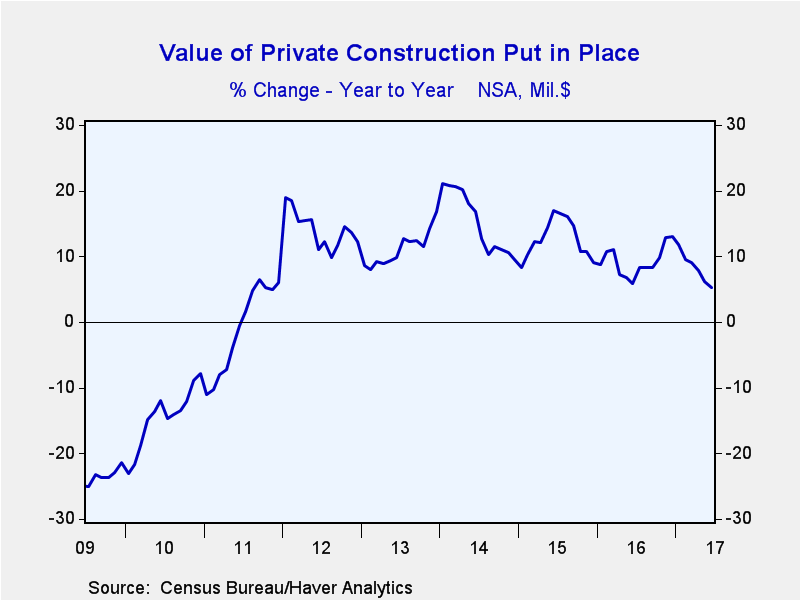
The value of construction put-in-place posted a surprisingly soft reading of -1.3% in June (+1.6% y/y), versus expectations (according to the Action Economics Forecast Survey) of a 0.4% increase. Revisions were mixed, with a slightly higher May report partially offsetting a sharply lower April figure. The net effect was a downward adjustment of 0.7 percentage points to past months.
Since peaking late last year at nearly a 10% y/y gain, construction spending has moderated sharply. The weakness has been particularly acute in the past three months, as total construction spending has fallen by 2.8% in that time.
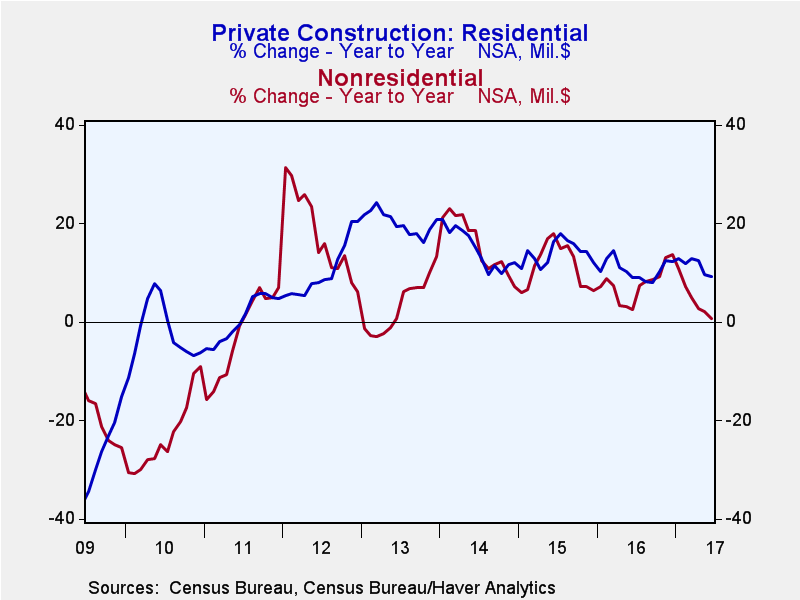
While residential spending continues to post solid 9.0% y/y gains, the last three months have been down, reflecting sharply lower improvements and multi-family structures. These categories tend to be very volatile.
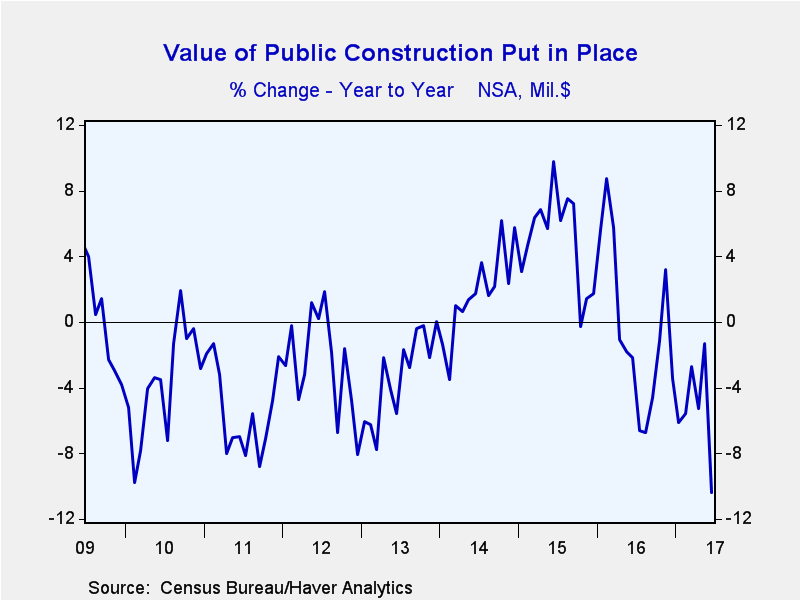
Public construction spending has been weak as well. Public nonresidential spending declined 8.1% in the past three months and 9.5% in the past year. In June, every major category of public nonresidential spending declined. The biggest contributors to the June drop were education (-5.5%) and roads (-6.6%).
The construction spending figures are in Haver's USECON database and the expectations reading is contained in the AS1REPNA database.
| Construction Put in Place (SA, %) | Jun | Apr | Mar | Jun Y/Y | 2016 | 2015 | 2014 |
|---|---|---|---|---|---|---|---|
| Total | -1.3 | 0.3 | -1.8 | 1.6 | 6.7 | 10.5 | 11.4 |
| Private | -0.1 | -0.1 | -0.9 | 5.3 | 9.2 | 12.5 | 15.4 |
| Residential | -0.2 | -0.8 | -0.4 | 9.2 | 10.6 | 13.8 | 14.6 |
| Nonresidential | 0.1 | 0.6 | -1.4 | 1.1 | 7.6 | 11.2 | 16.3 |
| Public | -5.4 | 1.9 | -4.7 | -9.5 | -0.4 | 5.0 | 1.9 |
Peter D'Antonio
AuthorMore in Author Profile »Peter started working for Haver Analytics in 2016. He worked for nearly 30 years as an Economist on Wall Street, most recently as the Head of US Economic Forecasting at Citigroup, where he advised the trading and sales businesses in the Capital Markets. He built an extensive Excel system, which he used to forecast all major high-frequency statistics and a longer-term macroeconomic outlook. Peter also advised key clients, including hedge funds, pension funds, asset managers, Fortune 500 corporations, governments, and central banks, on US economic developments and markets. He wrote over 1,000 articles for Citigroup publications. In recent years, Peter shifted his career focus to teaching. He teaches Economics and Business at the Molloy College School of Business in Rockville Centre, NY. He developed Molloy’s Economics Major and Minor and created many of the courses. Peter has written numerous peer-reviewed journal articles that focus on the accuracy and interpretation of economic data. He has also taught at the NYU Stern School of Business. Peter was awarded the New York Forecasters Club Forecast Prize for most accurate economic forecast in 2007, 2018, and 2020. Peter D’Antonio earned his BA in Economics from Princeton University and his MA and PhD from the University of Pennsylvania, where he specialized in Macroeconomics and Finance.
More Economy in Brief
 Global| Feb 05 2026
Charts of the Week: Balanced Policy, Resilient Data and AI Narratives
by:Andrew Cates


