 Global| Jun 01 2017
U.S. Construction Spending Gives Back Some Prior Gains
Summary
The value of construction put-in-place dipped 1.4% in April, following sharp weather-related gains totaling 3.9% in the first three months of the year. The April decline compares to expectations for a 0.5% gain in the Action Economics [...]
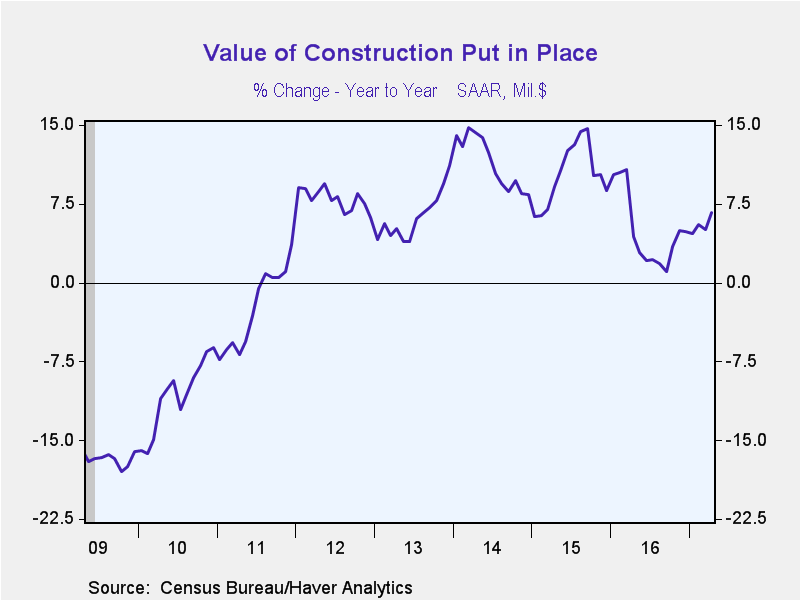
The value of construction put-in-place dipped 1.4% in April, following sharp weather-related gains totaling 3.9% in the first three months of the year. The April decline compares to expectations for a 0.5% gain in the Action Economics Forecast Survey. Despite the latest drop, construction spending was up 6.7% from a year earlier. The March figure was initially reported down 0.2%, but was revised up with the April report to a gain of 1.1%.
Private sector construction activity declined 0.7% in April, but nevertheless increased by 10.4% from a year earlier.
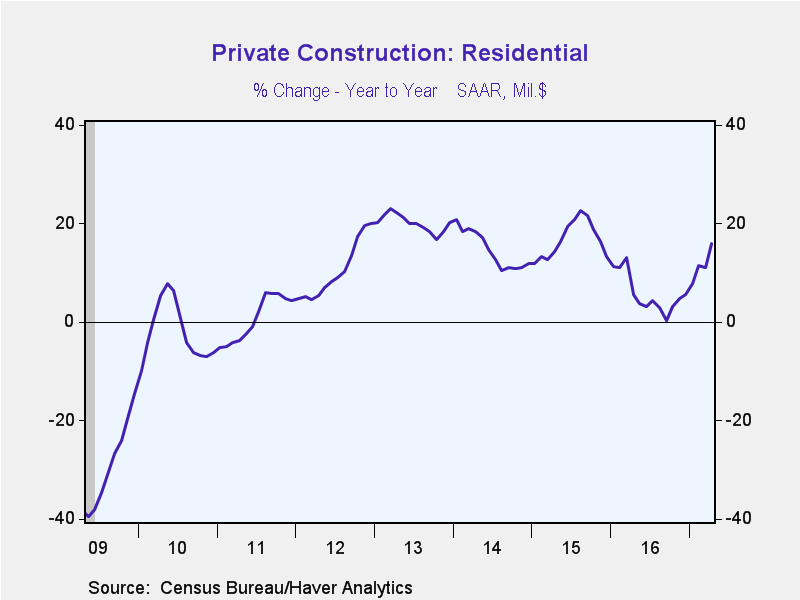
Residential spending declined 0.7% as well (+16.0% y/y), after six months of solid gains. The April decline was centered in the volatile improvements sector, which fell 2.9% (+32.3% y/y). Single-family building improved 0.8% (+7.7% y/y), while multifamily declined 0.2% (+10.3% y/y).
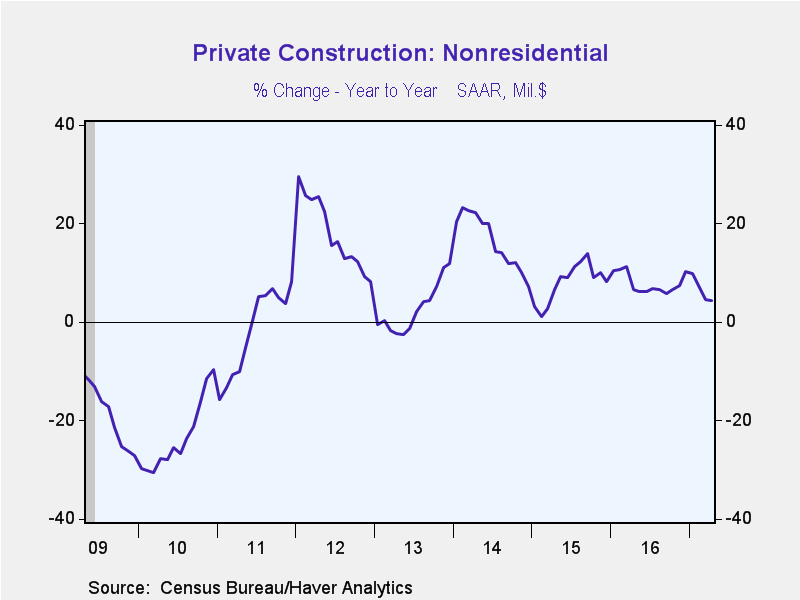
Nonresidential building activity fell 0.6% (+4.3% y/y), which was the third decline in a row. Office construction was the one major sector showing a gain in April, rising 1.8% (+14.8% y/y). Commercial construction eased 0.3% (+13.5% y/y), manufacturing sector construction dropped 1.9% (-8.4% y/y), health care building declined 1.1% (-0.1% y/y), and power plant construction fell 1.4% (+1.5% y/y).
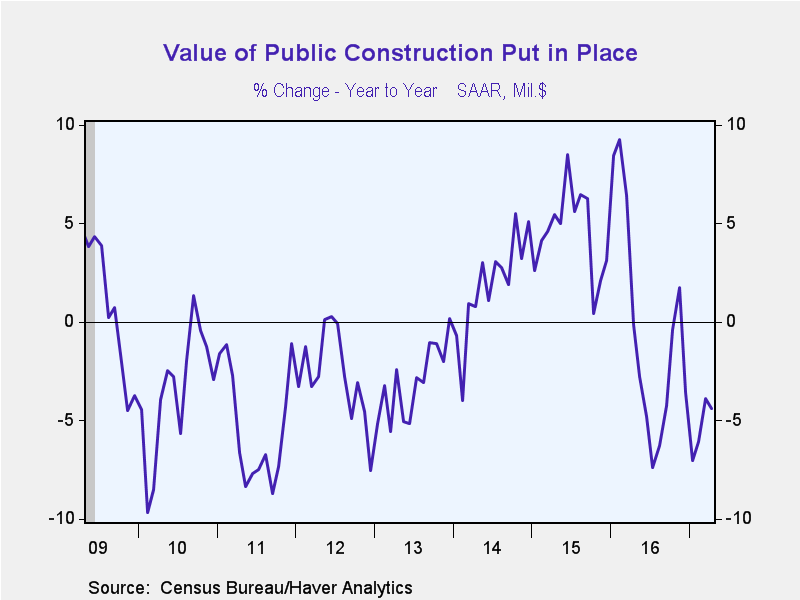
Public sector building activity declined 3.7% (-4.4% y/y), following gains totaling 4.2% in the prior two months. Education facility spending declined 2.0% (-0.2% y/y). Transportation facilities construction was off 2.0% (+2.4% y/y). Highway and streets, which constitutes about one-third of total public construction, dropped 3.7% (+0.3% y/y).
The construction spending figures are in Haver's USECON database and the expectations reading is contained in the AS1REPNA database.
| Construction Put in Place (SA, %) | Apr | Mar | Feb | Apr Y/Y | 2016 | 2015 | 2014 |
|---|---|---|---|---|---|---|---|
| Total | -1.4 | 1.1 | 1.9 | 6.7 | 4.8 | 10.3 | 11.4 |
| Private | -0.7 | 1.0 | 1.7 | 10.4 | 6.7 | 12.5 | 15.4 |
| Residential | -0.7 | 2.5 | 4.7 | 16.0 | 5.6 | 16.8 | 14.6 |
| Nonresidential | -0.6 | -0.7 | -1.5 | 4.3 | 7.8 | 8.1 | 16.3 |
| Public | -3.7 | 1.6 | 2.5 | -4.4 | -0.5 | 4.5 | 1.9 |
Peter D'Antonio
AuthorMore in Author Profile »Peter started working for Haver Analytics in 2016. He worked for nearly 30 years as an Economist on Wall Street, most recently as the Head of US Economic Forecasting at Citigroup, where he advised the trading and sales businesses in the Capital Markets. He built an extensive Excel system, which he used to forecast all major high-frequency statistics and a longer-term macroeconomic outlook. Peter also advised key clients, including hedge funds, pension funds, asset managers, Fortune 500 corporations, governments, and central banks, on US economic developments and markets. He wrote over 1,000 articles for Citigroup publications. In recent years, Peter shifted his career focus to teaching. He teaches Economics and Business at the Molloy College School of Business in Rockville Centre, NY. He developed Molloy’s Economics Major and Minor and created many of the courses. Peter has written numerous peer-reviewed journal articles that focus on the accuracy and interpretation of economic data. He has also taught at the NYU Stern School of Business. Peter was awarded the New York Forecasters Club Forecast Prize for most accurate economic forecast in 2007, 2018, and 2020. Peter D’Antonio earned his BA in Economics from Princeton University and his MA and PhD from the University of Pennsylvania, where he specialized in Macroeconomics and Finance.
More Economy in Brief
 Global| Feb 05 2026
Charts of the Week: Balanced Policy, Resilient Data and AI Narratives
by:Andrew Cates


