 Global| Oct 07 2009
U.S. Consumer Credit Outstanding Continues To Fall
by:Tom Moeller
|in:Economy in Brief
Summary
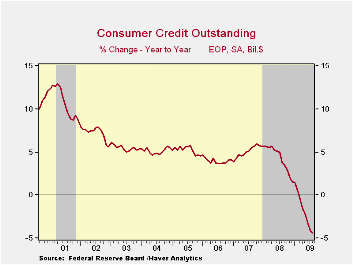
There's been no let-up in the deleveraging of consumer balance sheets. For the seventh consecutive month, the Federal Reserve reported that consumer credit outstanding has fallen. During August, it was down by $12.0, or 4.0% y/y, and [...]
 There's
been no let-up in the deleveraging of consumer balance sheets. For the
seventh consecutive month, the Federal Reserve reported that consumer
credit outstanding has fallen. During August, it was down by $12.0, or
4.0% y/y, and the sharper July decline was revised only slightly
shallower. The latest was the eleventh since last summer. The magnitude
of the cutbacks continues to impress as the y/y change amounted to a
record 4.4% drop. Double-digit monthly declines have prevailed all this
year. The latest decline was roughly double expectations.
There's
been no let-up in the deleveraging of consumer balance sheets. For the
seventh consecutive month, the Federal Reserve reported that consumer
credit outstanding has fallen. During August, it was down by $12.0, or
4.0% y/y, and the sharper July decline was revised only slightly
shallower. The latest was the eleventh since last summer. The magnitude
of the cutbacks continues to impress as the y/y change amounted to a
record 4.4% drop. Double-digit monthly declines have prevailed all this
year. The latest decline was roughly double expectations.
Usage of
non-revolving credit (autos & other consumer durables), which
accounts for nearly two-thirds of the total, fell $2.1B after the
record $16.6B July drop. The 2.4% y/y decline is near the record.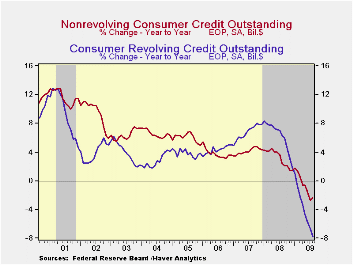 Additionally weighing on overall credit has been the tight rein on
revolving credit usage. During August, revolving credit outstanding
fell a near-record $9.9B for the eleventh consecutive monthly drop.
Year-to-year the 7.8% decline is by far the record as consumers left
their credit cards in their wallets.· With these declines, consumers
have been successful in reducing credit outstanding as a percentage of
disposable income to 22.6% from its 2005 high of 24.4%. This compares
to the low near 16% in the early-1990s. Now that the
"shop-till-you-drop" mantra has been diffused by the aging population
of the U.S., a return to a permanently lower level of credit usage is
likely.
Additionally weighing on overall credit has been the tight rein on
revolving credit usage. During August, revolving credit outstanding
fell a near-record $9.9B for the eleventh consecutive monthly drop.
Year-to-year the 7.8% decline is by far the record as consumers left
their credit cards in their wallets.· With these declines, consumers
have been successful in reducing credit outstanding as a percentage of
disposable income to 22.6% from its 2005 high of 24.4%. This compares
to the low near 16% in the early-1990s. Now that the
"shop-till-you-drop" mantra has been diffused by the aging population
of the U.S., a return to a permanently lower level of credit usage is
likely.
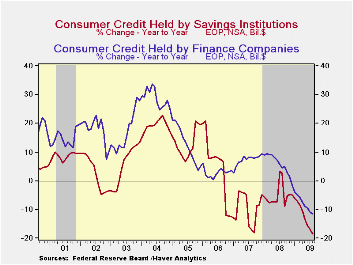 Finance
companies (-11.5% y/y) and savings institutions
(-18.5% y/y) have seen the largest pullbacks in credit extension while
commercial banks (+0.1% y/y) and credit unions continue to see
positive, though diminished growth. The Federal government and Sallie
Mae continued to lend during August by 20.6% y/y which was the
strongest growth rate since early 1991.
Finance
companies (-11.5% y/y) and savings institutions
(-18.5% y/y) have seen the largest pullbacks in credit extension while
commercial banks (+0.1% y/y) and credit unions continue to see
positive, though diminished growth. The Federal government and Sallie
Mae continued to lend during August by 20.6% y/y which was the
strongest growth rate since early 1991.
These figures are the major input to the Fed's quarterly Flow of Funds accounts for the household sector.
Credit data are available in Haver's USECON database. The Flow of Funds data are in Haver's FFUNDS database.
Predicting Crises, Part II: Did Anything Matter (to Everybody)? from the Federal Reserve Bank of San Francisco can be found here.
| Consumer Credit Outstanding (m/m Chg, SAAR) | August | July | Y/Y | 2008 | 2007 | 2006 |
|---|---|---|---|---|---|---|
| Total | $-12.0B | $-15.0B | -4.0% | 1.6% | 5.6% | 4.1% |
| Revolving | $-9.9B | $-2.4B | -7.8% | 1.9% | 7.8% | 5.0% |
| Non-revolving | $-2.1B | $-16.6B | -2.4% | 1.4% | 4.4% | 3.6% |

Tom Moeller
AuthorMore in Author Profile »Prior to joining Haver Analytics in 2000, Mr. Moeller worked as the Economist at Chancellor Capital Management from 1985 to 1999. There, he developed comprehensive economic forecasts and interpreted economic data for equity and fixed income portfolio managers. Also at Chancellor, Mr. Moeller worked as an equity analyst and was responsible for researching and rating companies in the economically sensitive automobile and housing industries for investment in Chancellor’s equity portfolio. Prior to joining Chancellor, Mr. Moeller was an Economist at Citibank from 1979 to 1984. He also analyzed pricing behavior in the metals industry for the Council on Wage and Price Stability in Washington, D.C. In 1999, Mr. Moeller received the award for most accurate forecast from the Forecasters' Club of New York. From 1990 to 1992 he was President of the New York Association for Business Economists. Mr. Moeller earned an M.B.A. in Finance from Fordham University, where he graduated in 1987. He holds a Bachelor of Arts in Economics from George Washington University.
More Economy in Brief

 Global| Feb 05 2026
Charts of the Week: Balanced Policy, Resilient Data and AI Narratives
by:Andrew Cates

