 Global| Sep 19 2007
U.S. CPI Total -0.1%, Core Up 0.1503%
Summary
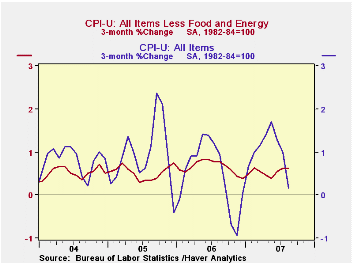
The consumer price index (CPI-U) edged down 0.1% in August, a bit softer than the Consensus forecast for unchanged. The 0.2% rise in prices less food & energy was in line with expectations. Actually, carried out to more decimal [...]

The consumer price index (CPI-U) edged down 0.1% in August, a bit softer than the Consensus forecast for unchanged. The 0.2% rise in prices less food & energy was in line with expectations. Actually, carried out to more decimal precision, the core rate was 0.15% in August, compared with 0.24% in July, so slower by almost 0.1%.
The year-to-year gain in core consumer prices of 2.1% was its slowest since March 2006.
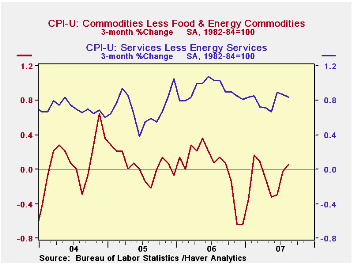
Core goods prices were flat on the month. July's 0.4% rise in apparel prices was reversed with a 0.4% decrease in August, producing a year/year decline of 1.5%; men's clothes and footwear had the largest declines, while women's clothes were down slightly and children's were up 0.3%. Among other major consumer items, vehicle prices were up 0.26%, with new vehicles higher by just 0.07% but used vehicles remain strong at 0.82%. Household furnishings were down 0.18%, almost the same as in July.
Core services prices rose 0.2% (3.2% y/y) following four consecutive months at 0.3%. Shelter prices rose just 0.15% (3.5% y/y) after July's 0.23%; owners' equivalent rent rose 0.23% (3.0% y/y) following July's 0.17%, but hotel rates -- lodging away from home -- fell 0.6% after July's 0.8% increase. Medical care services prices eased to a 0.5% increase (5.5% y/y) from 0.6% in July. Public transportation prices returned to their usual uptrend with a 0.5% rise; airfares were responsible for both a decline in July and August's pickup. Education service costs, including child care, rose 0.4%; most regular school fees slowed somewhat, but trade and technical school costs accelerated. Communications prices increased 0.1% (-0.8% y/y). Recreation goods and services fell 0.1% in August, putting the year/year change also at -0.1%; this is the first year-to-year decrease in this sub-index in its near-15-year history.
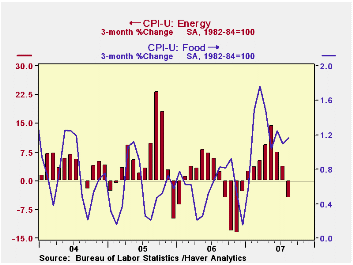
Energy prices fell 3.2% (-2.6% y/y) due to the 4.9% drop in gasoline prices (-6.4% y/y). Fuel oil prices stabilized with a 0.2% increase (0.5% y/y) after July's 3.4% jump, but natural gas & electricity prices fell 1.3% (+2.3% y/y).
Food & beverage prices rose 0.4% (4.2% y/y) as prices for meats, poultry & fish edged higher by 0.1% (5.4% y/y) following their decline in July. Dairy product prices remain very strong, up 1.7% in the month after July's 2.7%; these and previous advances put the year/year rate at 12.1%.
The chained CPI, which adjusts for shifts in the mix of consumer purchases, fell 0.1% (+1.8% y/y) for a second month; the core figure rose 0.2%, but its year/year increase slowed to 1.7% from 1.8% in the previous month.
| Consumer Price Index | Aug | July | June | Y/Y | 2006 | 2005 | 2004 |
|---|---|---|---|---|---|---|---|
| Total | -0.1% | 0.1% | 0.2% | 2.4% | 3.2% | 3.4% | 2.7% |
| Total less Food & Energy | 0.2% | 0.2% | 0.2% | 2.2% | 2.5% | 2.2% | 1.8% |
| Goods less Food & Energy | 0.0% | 0.1% | -0.1% | -0.6% | 0.2% | 0.5% | -0.9% |
| Services less Energy | 0.2% | 0.3% | 0.3% | 3.2% | 3.4% | 2.8% | 2.8% |
| Energy | -3.2% | -1.0% | -0.5% | 1.0% | 11.1% | 16.9% | 10.8% |
| Food & Beverages | 0.4% | 0.3% | 0.5% | 4.2% | 2.3% | 2.4% | 3.4% |
| Chained CPI: Total (NSA) | -0.1% | -0.1% | 0.2% | 2.1% | 2.8% | 2.9% | 2.5% |
| Total less Food & Energy | 0.2% | 0.0% | 0.0% | 1.8% | 2.3% | 1.9% | 1.7% |
Carol Stone, CBE
AuthorMore in Author Profile »Carol Stone, CBE came to Haver Analytics in 2003 following more than 35 years as a financial market economist at major Wall Street financial institutions, most especially Merrill Lynch and Nomura Securities. She had broad experience in analysis and forecasting of flow-of-funds accounts, the federal budget and Federal Reserve operations. At Nomura Securities, among other duties, she developed various indicator forecasting tools and edited a daily global publication produced in London and New York for readers in Tokyo. At Haver Analytics, Carol was a member of the Research Department, aiding database managers with research and documentation efforts, as well as posting commentary on select economic reports. In addition, she conducted Ways-of-the-World, a blog on economic issues for an Episcopal-Church-affiliated website, The Geranium Farm. During her career, Carol served as an officer of the Money Marketeers and the Downtown Economists Club. She had a PhD from NYU's Stern School of Business. She lived in Brooklyn, New York, and had a weekend home on Long Island.
More Economy in Brief
 Global| Feb 05 2026
Charts of the Week: Balanced Policy, Resilient Data and AI Narratives
by:Andrew Cates


