 Global| Feb 26 2009
U.S. Durable Goods Orders Lowest in Six Years; Latest Six-Month Decline a Record
by:Tom Moeller
|in:Economy in Brief
Summary
The recession in the U.S. factory sector entered an even more dire phase during the last several months. New orders for durable goods fell 5.2% last month after downwardly revised declines of between 4.0% and 8.0% during four of the [...]
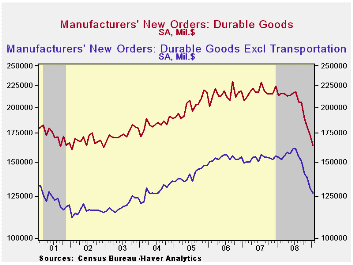 The
recession in the U.S. factory sector entered an even more dire phase
during the last several months. New orders for durable goods
fell 5.2% last month after downwardly revised declines of between 4.0%
and 8.0% during four of the prior five months. Since July new
orders have plummeted 24.9%, a record six-month drop. The
latest decline doubled Consensus expectations for a 2.4% drop.
The
recession in the U.S. factory sector entered an even more dire phase
during the last several months. New orders for durable goods
fell 5.2% last month after downwardly revised declines of between 4.0%
and 8.0% during four of the prior five months. Since July new
orders have plummeted 24.9%, a record six-month drop. The
latest decline doubled Consensus expectations for a 2.4% drop.
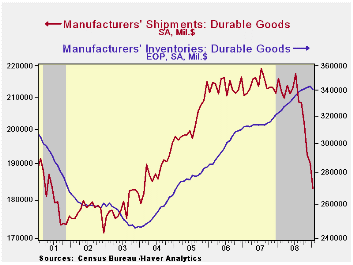
That shortfall in new orders has been aptly followed by lower shipments of durable goods. Off 3.7% in January, the decline followed shortfalls of between 3.0% and 4.0% during four of the prior five months. Year-to-year shipments fell 15.2% and they are down 15.9% during just the last six months. This extreme weakness has brought with it a 17.5% twelve-month decline in industrial production of durable goods. During the last ten years there has been an 83% correlation between the twelve-month change in shipments of durable goods and the change in durables industrial production.
 Last month, the production cuts may finally have
succeeded in curbing inventory accumulation. Inventories of
manufactured durables fell 0.8%, the first monthly decline since
2003. But more efforts to curb the inventory buildup are to
come. Six-month growth still amounted to 1.3%. And
while that's down from the peak, it compares to outright inventory
decumulation at an 8.0% rate during the last recession. Orders for
transportation equipment led last month's decline in orders for durable
goods with a 13.5% drop which left them off 38.7%
year-to-year. The aircraft sector led that shortfall with a
nearly three-quarters drop in nondefense bookings. Orders for
motor vehicles & parts fell by a lesser one-third during the
last year. Lower new orders for computers & electronic
products followed closely for the top weakest spot in last month's
decline with a 5.0% drop (-13.6% y/y) which followed the 7.1% December
shortfall. Orders for just computers & related
products were the weakest and posted a 16.0% drop and they're off by
more than one quarter during the last twelve months. Working
the other way were new orders for communications equipment which rose
1.2%. That recovered a piece of the 5.2% decline during
December and limited the year-to-year shortfall to just
2.6%.
Last month, the production cuts may finally have
succeeded in curbing inventory accumulation. Inventories of
manufactured durables fell 0.8%, the first monthly decline since
2003. But more efforts to curb the inventory buildup are to
come. Six-month growth still amounted to 1.3%. And
while that's down from the peak, it compares to outright inventory
decumulation at an 8.0% rate during the last recession. Orders for
transportation equipment led last month's decline in orders for durable
goods with a 13.5% drop which left them off 38.7%
year-to-year. The aircraft sector led that shortfall with a
nearly three-quarters drop in nondefense bookings. Orders for
motor vehicles & parts fell by a lesser one-third during the
last year. Lower new orders for computers & electronic
products followed closely for the top weakest spot in last month's
decline with a 5.0% drop (-13.6% y/y) which followed the 7.1% December
shortfall. Orders for just computers & related
products were the weakest and posted a 16.0% drop and they're off by
more than one quarter during the last twelve months. Working
the other way were new orders for communications equipment which rose
1.2%. That recovered a piece of the 5.2% decline during
December and limited the year-to-year shortfall to just
2.6%.
Most other industries have been notably hard hit by weakening demand. Orders for primary metals fell 4.6% last month and they're down by more than one-third during the last twelve. Machinery orders fell 2.0% last month and they're off 23.0% during the last year. Electrical equipment bookings reversed all of a downwardly revised December gain with a 6.1% flop. They're down by 22.1% during the last twelve months.
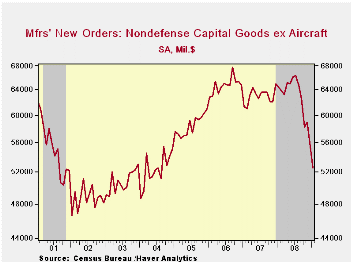
 Capital
equipment orders are very much
suffering from all this weakness in the front-end of the
economy. They fell 8.8% last month and are down 26.2% during
the last twelve. Orders for nondefense capital goods have been
particularly hard hit and they posted a 28.3% fall just in
January. Alone, aircraft orders have fallen by three-quarters
year-to-year. And without aircraft, nondefense capital goods
orders fell 5.4% during January and by 18.5% during the last twelve
months to their lowest level since 2004. During the last ten
years there has been an 80% correlation between the y/y change in
nondefense capital goods orders and the change in equipment &
software spending in the GDP accounts. The correlation of the
GDP figure with capital goods shipments is, as one would expect, a
larger 92%. The durable goods figures are available in
Haver's USECON database. The U.S. Auto
Industry from the Federal Reserve Bank of Cleveland can be
found here.
Capital
equipment orders are very much
suffering from all this weakness in the front-end of the
economy. They fell 8.8% last month and are down 26.2% during
the last twelve. Orders for nondefense capital goods have been
particularly hard hit and they posted a 28.3% fall just in
January. Alone, aircraft orders have fallen by three-quarters
year-to-year. And without aircraft, nondefense capital goods
orders fell 5.4% during January and by 18.5% during the last twelve
months to their lowest level since 2004. During the last ten
years there has been an 80% correlation between the y/y change in
nondefense capital goods orders and the change in equipment &
software spending in the GDP accounts. The correlation of the
GDP figure with capital goods shipments is, as one would expect, a
larger 92%. The durable goods figures are available in
Haver's USECON database. The U.S. Auto
Industry from the Federal Reserve Bank of Cleveland can be
found here.
| NAICS Classification (%) | January | December | Y/Y | 2008 | 2007 | 2006 |
|---|---|---|---|---|---|---|
| Durable Goods Orders | -5.2 | -4.6 | -23.3 | -5.8 | 1.4 | 6.2 |
| Excluding Transportation | -2.5 | -5.5 | -17.4 | -1.3 | -0.3 | 9.1 |
| Nondefense Capital Goods | -2.7 | -10.2 | -28.3 | -6.7 | 3.5 | 9.4 |
| Excluding Aircraft | -5.4 | -5.8 | -18.5 | -0.3 | -2.7 | 10.7 |

Tom Moeller
AuthorMore in Author Profile »Prior to joining Haver Analytics in 2000, Mr. Moeller worked as the Economist at Chancellor Capital Management from 1985 to 1999. There, he developed comprehensive economic forecasts and interpreted economic data for equity and fixed income portfolio managers. Also at Chancellor, Mr. Moeller worked as an equity analyst and was responsible for researching and rating companies in the economically sensitive automobile and housing industries for investment in Chancellor’s equity portfolio. Prior to joining Chancellor, Mr. Moeller was an Economist at Citibank from 1979 to 1984. He also analyzed pricing behavior in the metals industry for the Council on Wage and Price Stability in Washington, D.C. In 1999, Mr. Moeller received the award for most accurate forecast from the Forecasters' Club of New York. From 1990 to 1992 he was President of the New York Association for Business Economists. Mr. Moeller earned an M.B.A. in Finance from Fordham University, where he graduated in 1987. He holds a Bachelor of Arts in Economics from George Washington University.
More Economy in Brief

 Global| Feb 05 2026
Charts of the Week: Balanced Policy, Resilient Data and AI Narratives
by:Andrew Cates

