 Global| Mar 24 2005
U.S. Durable Goods Orders Up Slightly
by:Tom Moeller
|in:Economy in Brief
Summary
Durable goods orders rose 0.3% last month following a 1.1% decline in January that was deeper than initially estimated. Consensus expectations had been for a 0.8% gain. Nondefense capital goods orders were about unchanged after an [...]
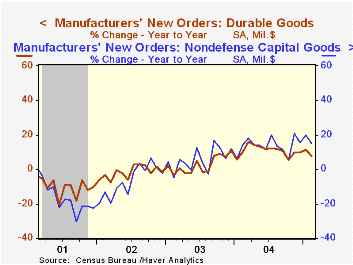
Durable goods orders rose 0.3% last month following a 1.1% decline in January that was deeper than initially estimated. Consensus expectations had been for a 0.8% gain.
Nondefense capital goods orders were about unchanged after an upwardly revised gain in January. Less aircraft orders fell 2.1% but the January increase was sharply higher than initially reported.
Higher orders for computers & electronic paced the February gain with a 1.2% (10.9% y/y) rise. Orders for transportation equipment also rose 1.6% (-2.5% y/y).
Electrical equipment orders gave back 4.5% (+6.8% y/y) of a 13.7% jump in January and machinery orders fell 1.1% (+14.4% y/y). Primary metals orders ticked 0.6% (17.1% y/y) higher but orders for fabricated metals fell.
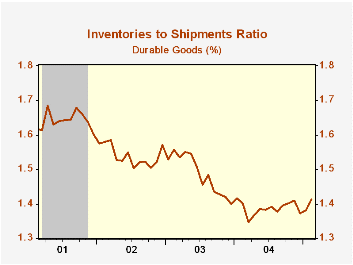
Inventories of durable goods added 0.6% (9.5% y/y) to an upwardly revised 1.6% jump in January. However, shipments fell 1.6% (8.5% y/y) and caused the I/S ratio to rise.
Unfilled orders rose 0.6% and pulled the ratio of backlogs to shipments to the highest level since November.
| NAICS Classification | Feb | Jan | Y/Y | 2004 | 2003 | 2002 |
|---|---|---|---|---|---|---|
| Durable Goods Orders | 0.3% | -1.1% | 7.7% | 10.8% | 2.6% | -1.7% |
| Nondefense Capital Goods | -0.0% | 1.1% | 15.2% | 13.7% | 5.6% | -7.2% |
| Excluding Aircraft | -2.1% | 4.4% | 13.6% | 11.7% | 6.6% | -7.1% |
by Tom Moeller March 24, 2005
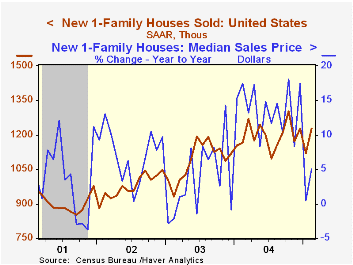
Sales of new single-family homes recovered 9.4% in February to 1.226M after the little revised 8.6% January decline. Consensus estimates had been for sales of 1.150M.
The rise in sales last month was led by a 9.9% recovery in the Midwest (-6.8% y/y) after the one-third drop in January. In the Northeast sales surged 20.3% (-3.5% y/y) and in the South sales jumped 9.0% (+15.5% y/y). In the West sales gained 7.4% (-1.7% y/y).
The median price of a new single family home jumped 9.6% to $230,700 (+5.1% y/y).
The figures from the Census Department reflect homes sold.
| Homes Sales (000s, AR) | Feb | Jan | Y/Y | 2004 | 2003 | 2002 |
|---|---|---|---|---|---|---|
| New Single-Family | 1,226 | 1,121 | 5.2% | 1,198 | 1,089 | 976 |
by Tom Moeller March 24, 2005
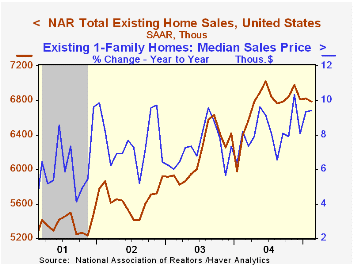
Sales of existing single family homes slipped 0.4% in February to 6.79M January. Consensus expectations had been for sales of 6.70M.
Improved methodology and better modeling led to monthly revisions back through 1999. The figures reflect closings of home sales in earlier months.
Sales were mixed m/m across the country's regions. In the Northeast sales rose 4.6% (+4.6% y/y) and in the Midwest sales rose 2.0% (+4.2% y/y). In the South sales fell 3.4% (+8.0% y/y) and in the West sales were unchanged (+6.7% y/y).
The median price of an existing home single family home rose m/m to $188,200 (+9.4% y/y).
The latest release from the National Association of Realtors is available here.
| Existing Home Sales (000, AR) | Feb | Jan | Y/Y | 2004 | 2003 | 2002 |
|---|---|---|---|---|---|---|
| Existing Single-Family | 6,790 | 6,820 | 6.1% | 6,723 | 6,170 | 5,653 |
by Tom Moeller March 24, 2005
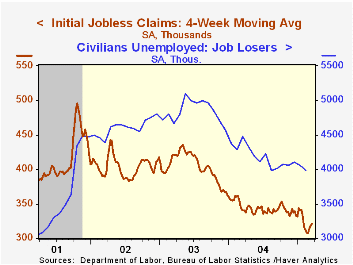
Initial claims for unemployment insurance rose 3,000 to 324,000 last week and the level of claims during the prior two weeks was revised slightly higher. Consensus expectations had been for 315,000 claims.
The revisions raised the increase in claims during the March survey period for nonfarm payrolls to 18,000 (+5.9%) versus the February period.
During the last ten years there has been a (negative) 75% correlation between the level of initial claims for unemployment insurance and the monthly change in payroll employment. There has been a (negative) 66% correlation with the level of continuing claims.
The four week moving average of initial claims rose to 321,750 (-5.4% y/y).
Continuing claims for unemployment insurance rose 31,000 from the prior week and the insured rate of unemployment remained at 2.1%.
| Unemployment Insurance (000s) | 03/19/05 | 03/12/05 | Y/Y | 2004 | 2003 | 2002 |
|---|---|---|---|---|---|---|
| Initial Claims | 324 | 321 | -5.8% | 343 | 402 | 404 |
| Continuing Claims | -- | 2,673 | -11.7% | 2,926 | 3,531 | 3,570 |
by Carol Stone March 24, 2005
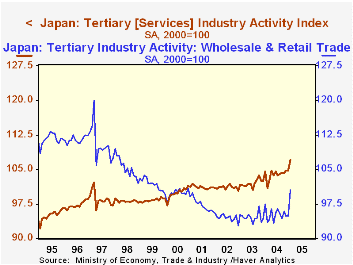
Service sector activity in Japan advanced vigorously in January, according to the report on "Tertiary Industry Activity" published today by the Ministry of Economy, Trade and Industry (METI). The index for all industries rose from December's 104.7 (2002=100) to 107.0, or 2.2%; the gain from the year-earlier level was 2.5%.
Participation by various industry groups varied widely, as illustrated in the table below. Wholesale and retail trade was up 5.9% and financial services by 2.9%, but information and communication dropped 7.9%. Most other sectors showed some increase, generating the rise in the overall total.
Before we conclude that the Japanese economy has shifted onto a new vigorous growth path, we need to take account of what might be called the "January effect" regarding seasonality. As in many countries, economic activity in Japan strengthens in December and weakens significantly in January, with a commensurate rise in the seasonal factor for December and a steep decline in January. This means that a seasonally adjusted "gain" in January could actually be a statistical construct; in fact, the unadjusted all-industry index fell 11.3% from December, at a time when the seasonal factor presumes a 13.3% drop, so that after seasonal adjustment, the index increased on the order of 2%. The trade industries are a sub-sector where this occurs most distinctly; that seasonal factor declines about 23% in January, so that any year in which January sales activity falls by "just" 22% will show a nice seasonally adjusted rise for January. ["Seasonal factor" in this discussion is the implicit seasonal derived from dividing the unadjusted by the adjusted data. See the second graph for an example.]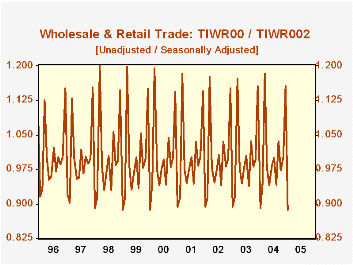
This extreme movement in seasonality can easily exaggerate the strength of an activity that simply doesn't fall as much as the seasonal statistics anticipate. The low level of the seasonal factors then mean that the unadjusted data are magnified more than in other months, yielding out-sized gains. These may indeed indicate genuine progress in economic activity, but they might also be a fluke; if so, they will wash out, generally during the spring months when the seasonals expect a normal growth pace that may not be matched by the actual performance. Growth, supported in the winter, might then weaken noticeably during the spring. Such patterns occur often in the US, as well, particularly with housing and construction data.
| Index, 2002=100, SA | Jan 2005 | Dec 2004 | Year Ago | 2004 | 2003 | 2002 |
|---|---|---|---|---|---|---|
| All Industries | 107.0 | 104.7 | 104.6 | 103.9 | 102.0 | 101.1 |
| Information & Communication | 111.3 | 120.9 | 114.6 | 114.3 | 114.5 | 113.1 |
| Wholesale & Retail Trade | 100.4 | 94.8 | 97.5 | 95.1 | 94.5 | 94.5 |
| Finance Services | 111.7 | 108.5 | 108.0 | 109.2 | 104.2 | 102.7 |
Tom Moeller
AuthorMore in Author Profile »Prior to joining Haver Analytics in 2000, Mr. Moeller worked as the Economist at Chancellor Capital Management from 1985 to 1999. There, he developed comprehensive economic forecasts and interpreted economic data for equity and fixed income portfolio managers. Also at Chancellor, Mr. Moeller worked as an equity analyst and was responsible for researching and rating companies in the economically sensitive automobile and housing industries for investment in Chancellor’s equity portfolio. Prior to joining Chancellor, Mr. Moeller was an Economist at Citibank from 1979 to 1984. He also analyzed pricing behavior in the metals industry for the Council on Wage and Price Stability in Washington, D.C. In 1999, Mr. Moeller received the award for most accurate forecast from the Forecasters' Club of New York. From 1990 to 1992 he was President of the New York Association for Business Economists. Mr. Moeller earned an M.B.A. in Finance from Fordham University, where he graduated in 1987. He holds a Bachelor of Arts in Economics from George Washington University.
More Economy in Brief
 Global| Feb 05 2026
Charts of the Week: Balanced Policy, Resilient Data and AI Narratives
by:Andrew Cates


