 Global| Jan 26 2021
U.S. FHFA House Price Index Rose Further in November
by:Sandy Batten
|in:Economy in Brief
Summary
• House prices rose 1.0% m/m, the sixth consecutive monthly increase of 1.0% or more. • Prices were up 11.0% y/y, a series record annual increase. The Federal Housing Finance Agency (FHFA) House Price Index increased 1.0% m/m in [...]
• House prices rose 1.0% m/m, the sixth consecutive monthly increase of 1.0% or more.
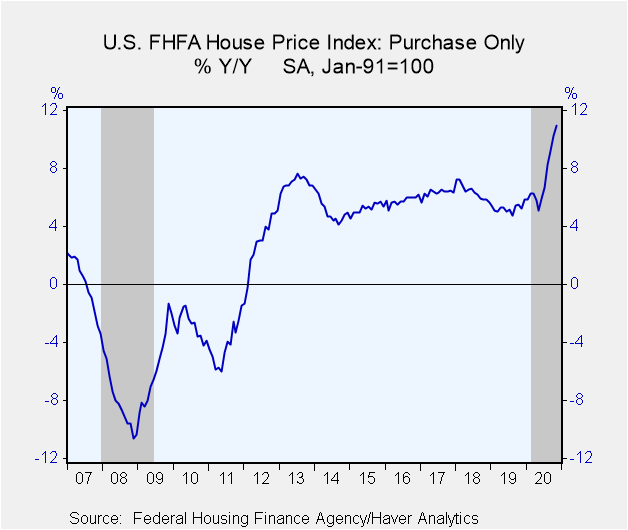
• Prices were up 11.0% y/y, a series record annual increase.
The Federal Housing Finance Agency (FHFA) House Price Index increased 1.0% m/m in November following an unrevised 1.5% m/m gain in October. This was the sixth consecutive month in which house prices had risen by 1.0% or more. Prior to this six-month run, this index had risen 1% or more in only five months in the series history dating back to January 1991. Compared to a year ago, house prices were up 11.0%, the highest annual rate of increase in the series history. Over the past six months, house prices rose 17.2% annualized, also their highest six-month advance ever.
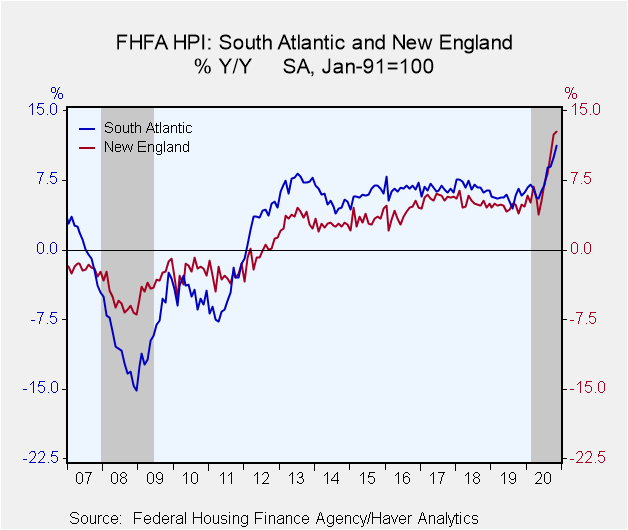
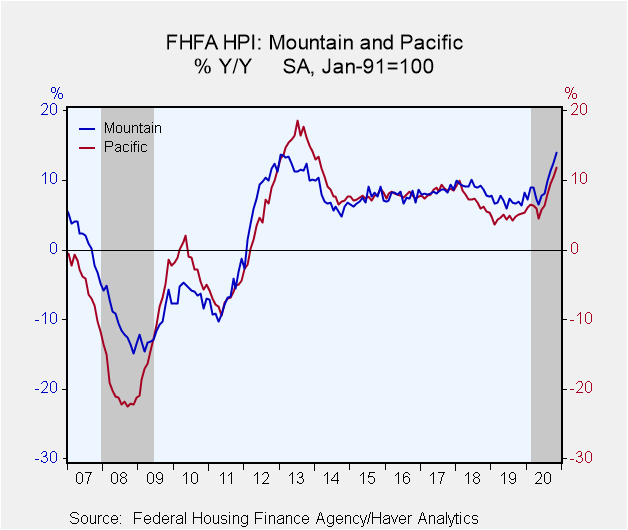
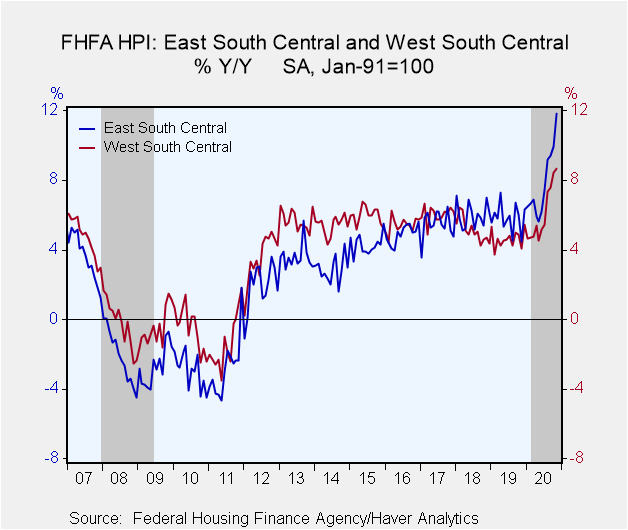
House prices rose in each census division in November from October and also in November from a year ago. Seasonally adjusted monthly house price changes in November from October ranged from +0.3% in the West South Central division to +1.6% in the Pacific division. The 12-month changes ranged from +8.7% in the West South Central division to +14.0% in the Mountain division. Annual advances were at series highs in four of the nine divisions.
The FHFA house price index is a weighted purchase-only index that measures average price changes in repeat sales of the same property. An associated quarterly index includes refinancings on the same kinds of properties. The indexes are based on transactions involving conforming, conventional mortgages purchased or securitized by Fannie Mae or Freddie Mac. Only mortgage transactions on single-family properties are included. The FHFA data are available in Haver's USECON database.
| FHFA U.S. House Price Index, Purchase Only (SA %) |
Nov | Oct | Sep | Nov Y/Y | 2019 | 2018 | 2017 |
|---|---|---|---|---|---|---|---|
| Total | 1.0 | 1.5 | 1.7 | 11.0 | 5.3 | 6.5 | 6.3 |
| New England | 1.2 | 2.1 | 2.1 | 12.8 | 4.6 | 5.1 | 5.6 |
| Middle Atlantic | 0.4 | 1.7 | 2.1 | 10.6 | 4.5 | 5.3 | 4.7 |
| East North Central | 1.1 | 1.5 | 1.5 | 10.4 | 5.4 | 6.4 | 5.8 |
| West North Central | 0.4 | 0.8 | 2.0 | 9.7 | 5.1 | 6.0 | 5.1 |
| South Atlantic | 1.2 | 1.6 | 1.6 | 11.2 | 5.7 | 7.0 | 6.5 |
| East South Central | 1.2 | 0.8 | 2.0 | 11.8 | 5.9 | 6.0 | 5.5 |
| West South Central | 0.3 | 1.3 | 0.9 | 8.7 | 4.7 | 5.2 | 6.0 |
| Mountain | 1.3 | 1.6 | 2.0 | 14.0 | 7.1 | 9.0 | 8.3 |
| Pacific | 1.6 | 1.7 | 13.8 | 11.8 | 4.7 | 7.3 | 8.4 |
Sandy Batten
AuthorMore in Author Profile »Sandy Batten has more than 30 years of experience analyzing industrial economies and financial markets and a wide range of experience across the financial services sector, government, and academia. Before joining Haver Analytics, Sandy was a Vice President and Senior Economist at Citibank; Senior Credit Market Analyst at CDC Investment Management, Managing Director at Bear Stearns, and Executive Director at JPMorgan. In 2008, Sandy was named the most accurate US forecaster by the National Association for Business Economics. He is a member of the New York Forecasters Club, NABE, and the American Economic Association. Prior to his time in the financial services sector, Sandy was a Research Officer at the Federal Reserve Bank of St. Louis, Senior Staff Economist on the President’s Council of Economic Advisors, Deputy Assistant Secretary for Economic Policy at the US Treasury, and Economist at the International Monetary Fund. Sandy has taught economics at St. Louis University, Denison University, and Muskingun College. He has published numerous peer-reviewed articles in a wide range of academic publications. He has a B.A. in economics from the University of Richmond and a M.A. and Ph.D. in economics from The Ohio State University.


