 Global| Sep 20 2018
U.S. Financial Accounts See Borrowing Ease with Downswing in Federal Government Needs
Summary
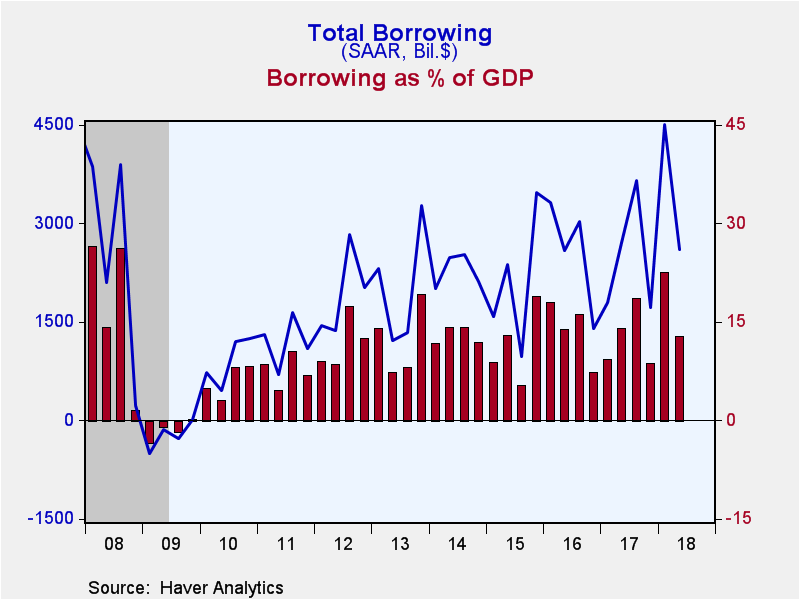
Borrowing in U.S. financial markets slowed in Q2 2018, according to the Federal Reserve's Financial Accounts data, totaling $2,596 billion at a seasonally adjusted annual rate, compared to $4,512 billion in Q1. The federal government [...]
Borrowing in U.S. financial markets slowed in Q2 2018, according to the Federal Reserve's Financial Accounts data, totaling $2,596 billion at a seasonally adjusted annual rate, compared to $4,512 billion in Q1. The federal government was again the main driver of the swing, as it was in the previous several quarters. The government borrowed $1,186 billion in Q2, well less than half the $2,828 billion in Q1, which had followed a net paydown of $340 billion in Q4 2017. Note that these are annual rates and they are seasonally adjusted, so seasonal swings in some revenues or expenditures would not be the major cause of the sizable move in government borrowing. Relative to GDP, the total amount of borrowing in Q2 was 12.7%, down from 22.5% in Q1.
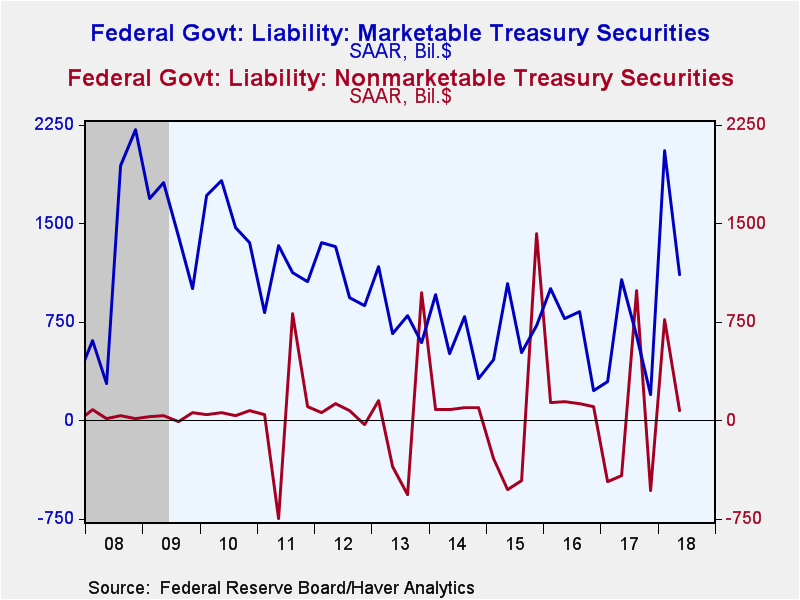
Regarding the federal government's borrowing, we've previously described sizable swings in both the Treasury's marketable and nonmarketable debt. In Q1, both of those had increased; in Q2 they were both moderately smaller. Marketable securities increased $1,113 billion in Q2 after $2,056 billion in Q1. Nonmarketable debt increased a modest $78 billion in Q2, following $771 billion in Q1.
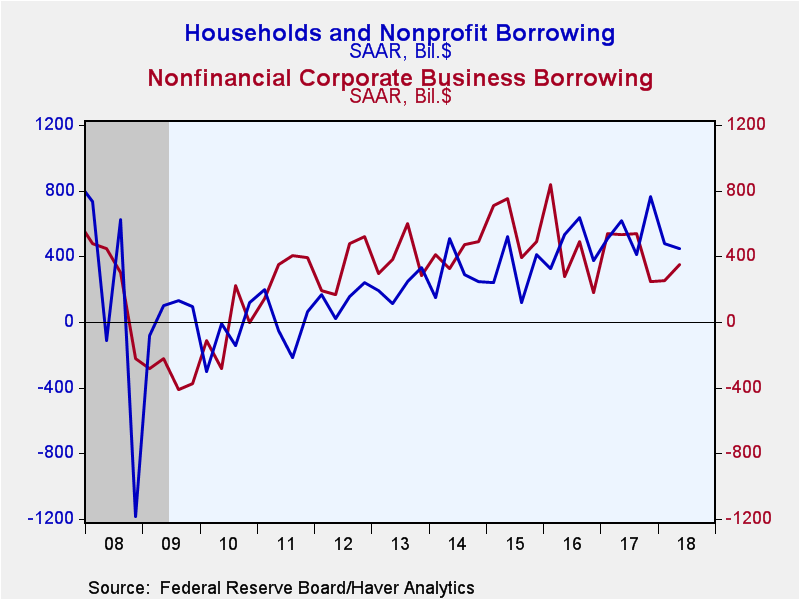
Credit demand from the two major non-governmental sectors, households and corporate business, changed little in Q2 compared with Q1. Households had borrowed $479 billion, SAAR, in Q1 and their needs went down slightly to $449 billion in Q2. Home mortgages increased $257 billion in Q2, less than the $297 billion the quarter before. In contrast, during pre-credit-crisis period, home mortgages grew by $1.081 billion in 2005 and $1,000 billion in 2006. In Q2 2018, consumer credit grew $156 billion, a bit more than the $126 billion in Q1. The ratio of household borrowing to disposable income was 2.7% in Q2. This remains in the range of recent years, and it contrasts with a range of 11-12% in the years just before the Great Recession.
Nonfinancial corporate business borrowing picked up slightly in Q2, reaching $353 billion in Q1, compared to $251 billion in Q1. Notably, corporations paid down their bond debt; it fell $23 billion SAAR, after net issuance of $273 billion in Q1. Depository institution loans to business grew $93 billion in Q2 after $28 billion in Q1. Companies' main source of credit in Q2 was "other loans and advances," which increased $158 billion following net paydowns of $105 billion in Q1.
Financial institutions borrowed at a $235 billion annual rate in Q2, down from $404 billion in Q1. This extends a trend of modest borrowing, which, as with other sectors, contrasts dramatically with heavy credit usage before the Great Recession.
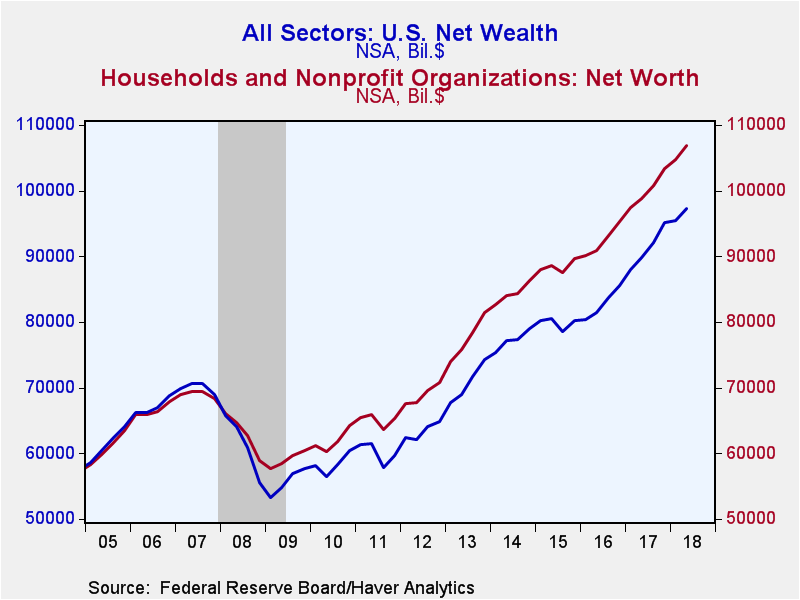
Press reports of these Financial Accounts highlight household balance sheets and net worth. Net worth again went up in Q2, reaching $106.9 trillion (amount outstanding, not seasonally adjusted) from $104.7 trillion at the end of Q1. Holdings of corporate equities and mutual fund shares increased $730 billion (not seasonally adjusted quarterly change), holdings of debt securities and loans by $325 billion, equity in noncorporate businesses $368 billion, and pension entitlements $226 billion. Real estate holdings and other nonfinancial assets gained $625 billion. Household liabilities increased $132 billion.
Net wealth of the total economy rose in Q2 after barely increasing in Q1. It amounted to $97.2 trillion on June 30, up from $95.4 billion on March 31 (levels, not seasonally adjusted). The total market value of domestic corporations, which had decreased slightly in Q1, gained in Q2 from $38.0 trillion to $39.5 trillion. Net financial claims on the "rest of the world" were -$5.833 trillion at end-Q2, a larger deficit than Q1's -$5.084 trillion. The remainder of the net wealth measure consists of nonfinancial assets held by households, noncorporate business and governments; these totaled $63.521 trillion on June 30, up $1,005 billion from March 31.
The Financial Accounts data are in Haver's FFUNDS database. Associated information is compiled in the Integrated Macroeconomic Accounts produced jointly with the Bureau of Economic Analysis (BEA); these are carried in Haver's USNA database as well as FFUNDS.
Carol Stone, CBE
AuthorMore in Author Profile »Carol Stone, CBE came to Haver Analytics in 2003 following more than 35 years as a financial market economist at major Wall Street financial institutions, most especially Merrill Lynch and Nomura Securities. She has broad experience in analysis and forecasting of flow-of-funds accounts, the federal budget and Federal Reserve operations. At Nomura Securites, among other duties, she developed various indicator forecasting tools and edited a daily global publication produced in London and New York for readers in Tokyo. At Haver Analytics, Carol is a member of the Research Department, aiding database managers with research and documentation efforts, as well as posting commentary on select economic reports. In addition, she conducts Ways-of-the-World, a blog on economic issues for an Episcopal-Church-affiliated website, The Geranium Farm. During her career, Carol served as an officer of the Money Marketeers and the Downtown Economists Club. She has a PhD from NYU's Stern School of Business. She lives in Brooklyn, New York, and has a weekend home on Long Island.


