 Global| Mar 12 2020
U.S. Financial Accounts Show Less Government Borrowing in Q4; Businesses Paid Down Some Debt
Summary
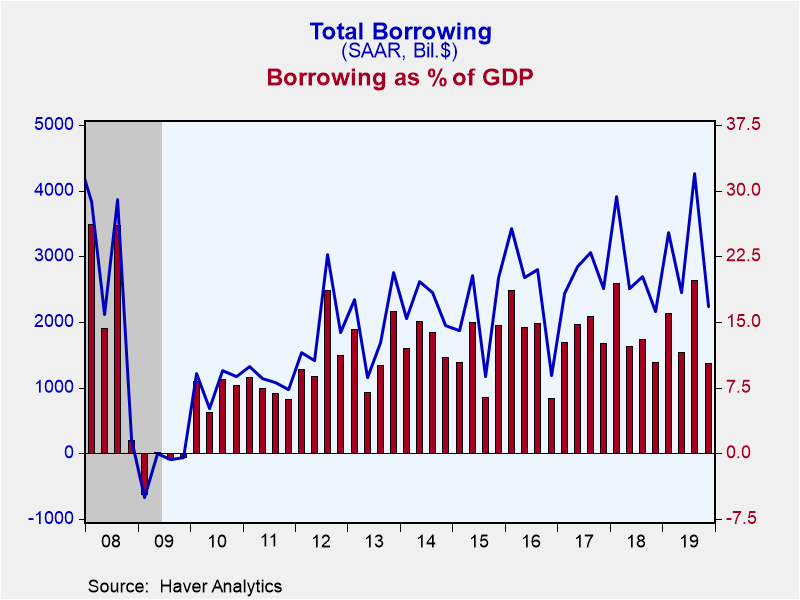
Total borrowing in U.S. financial markets decreased to $2,244 billion in Q4 2019 from $4,256 billion in Q3, according to the Federal Reserve's Financial Accounts data, published today, March 12. The Q4 amount was 10.3% of GDP, much [...]
Total borrowing in U.S. financial markets decreased to $2,244 billion in Q4 2019 from $4,256 billion in Q3, according to the Federal Reserve's Financial Accounts data, published today, March 12. The Q4 amount was 10.3% of GDP, much less than the 19.8% in Q3. Note that all the dollar figures quoted here are seasonally adjusted annual rates.
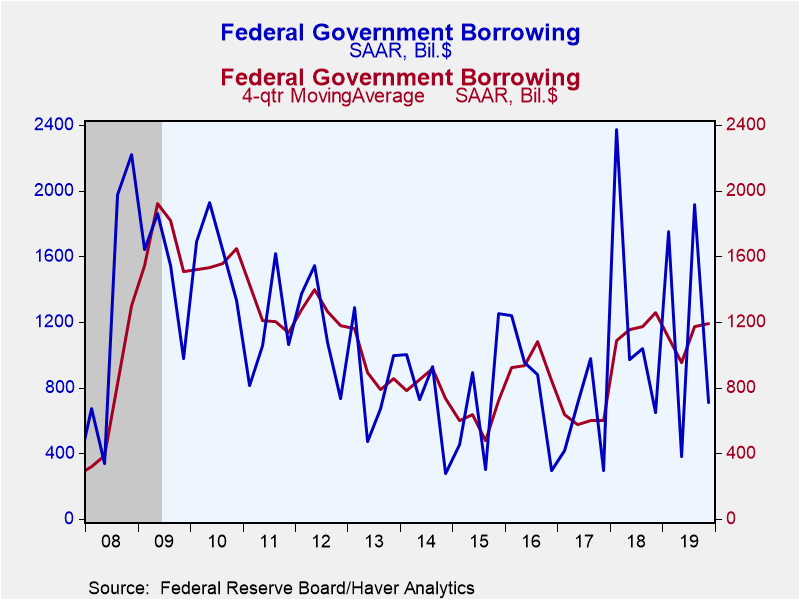
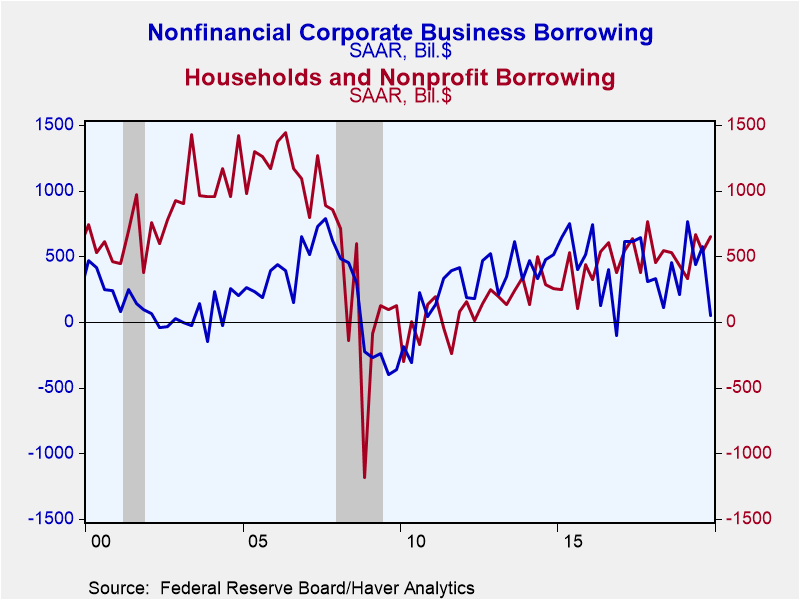
Divided among various sectors of the economy, Q4 borrowing was more moderate in all but one, households. As in Q3, the prime mover was the federal government; it borrowed at a seasonally adjusted annual rate of $712 billion in Q4, much less than the $1,919 billion in Q3. Nonfinancial corporate business used credit at just a $52 billion annual rate, compared to $576 billion in Q3. Financial institutions and foreign borrowers both used noticeably less credit in Q4. Households, by contrast. Increased their credit use in Q4, although the amount, $653 billion, represented a relatively moderate magnitude of increase from Q3’s $535 billion.
Nonfinancial corporations actually paid down some debt in Q4: corporate bonds at a $69 billion annual rate and commercial paper at a $23 billion rate. They borrowed $30 billion in municipal bonds, that is, largely industrial revenue bonds issued for specific purposes through municipalities. Loans from banks and other lending institutions grew at a $114 billion annual rate, less than Q3’s $194 billion. Together, nonfinancial corporate businesses’ borrowing covered just 2.5% of their capital spending in Q4; this compares to an average of 22% over the last five years.
Financial institutions borrowed $211 billion in Q4, down markedly from $570 billion in Q3. This is just 1.0% of GDP; that is a relatively small amount for recent years, which have tended around 2%, but it contrasts noticeably with the net paydowns during the Great Recession.
Breaking out some detail on the household sector, the Q4 increase was actually outside consumer households. This broad sector also includes nonprofit institutions and specialized agencies. Ordinary consumer borrowing in home mortgages was little changed in Q4 at a $332 billion annual rate versus $316 billion in Q3. Consumer credit grew less in Q4, $185 billion versus $200 billion in Q3. The reductions were in auto loans, $42 billion down from $48 billion, student loans, $73 billion down from $77 billion, and “other” consumer credit, $20 billion versus $36 billion. Credit card and other revolving credit picked up, with Q4 at $49 billion versus $39 billion in Q3. All together household borrowing equaled 3.9% of disposable income in Q4, up from 3.1% in Q3. For comparison, people borrowed more than 12% of disposable income before the Great Recession and then paid down as much as 10% during that contraction.
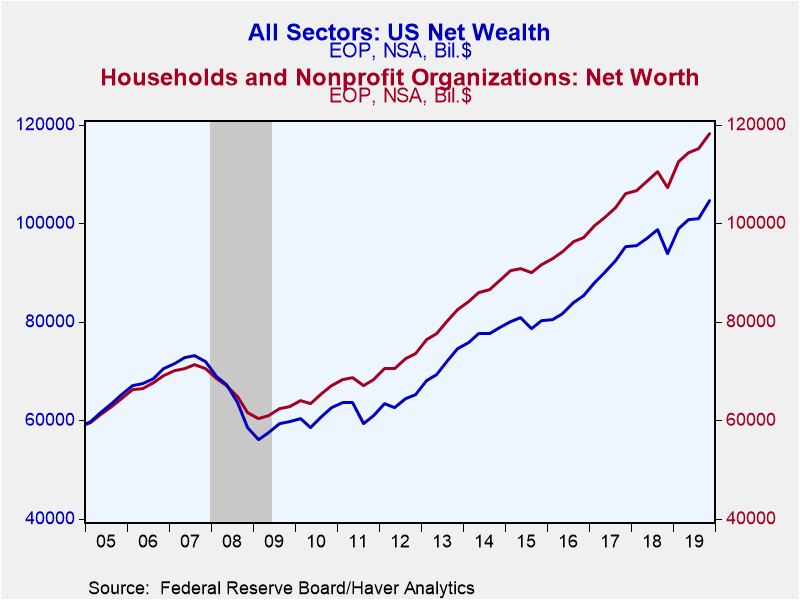
Net wealth of the total U.S. economy increased $3.72 trillion in Q4 (actual quarterly change), much more than the $277 billion increase in Q3. Of the $3.7 trillion increase, $3.5 trillion represented the market value of domestic corporations, that is, basically the stock market’s total value. Total net wealth on December 31, 2019, was $104.7 trillion, up from $101.0 trillion on September 30. Households’ net worth at year-end was $118.4 trillion up from $115.2 trillion on September 30; besides stock market holdings of $30.8 trillion (including both direct holdings and mutual fund shares), households owned $29.3 trillion in real estate, which would be partially offset by $10.6 trillion in home mortgages.
The Financial Accounts data are in Haver's FFUNDS database. Associated information is compiled in the Integrated Macroeconomic Accounts produced jointly with the Bureau of Economic Analysis (BEA); these are carried in Haver's USNA database as well as in FFUNDS.
| Financial Accounts (SAAR, Bil.$) | Q4'19 | Q3'19 | Q2'19 | 2019 | 2018 | 2017 | 2016 |
|---|---|---|---|---|---|---|---|
| Total Borrowing* | 2,240 | 4,256 | 2,455 | 3,078 | 2,822 | 2,709 | 2,523 |
| Federal Government | 712 | 1,919 | 382 | 1,191 | 1,258 | 599 | 843 |
| Households | 653 | 535 | 669 | 548 | 487 | 579 | 460 |
| Nonfinancial Corporate Business | 52 | 576 | 437 | 458 | 277 | 544 | 292 |
| Financial Sectors | 211 | 570 | 439 | 390 | 346 | 325 | 468 |
| Foreign Sector | 175 | 331 | 376 | 202 | 178 | 402 | 38 |
Carol Stone, CBE
AuthorMore in Author Profile »Carol Stone, CBE came to Haver Analytics in 2003 following more than 35 years as a financial market economist at major Wall Street financial institutions, most especially Merrill Lynch and Nomura Securities. She had broad experience in analysis and forecasting of flow-of-funds accounts, the federal budget and Federal Reserve operations. At Nomura Securities, among other duties, she developed various indicator forecasting tools and edited a daily global publication produced in London and New York for readers in Tokyo. At Haver Analytics, Carol was a member of the Research Department, aiding database managers with research and documentation efforts, as well as posting commentary on select economic reports. In addition, she conducted Ways-of-the-World, a blog on economic issues for an Episcopal-Church-affiliated website, The Geranium Farm. During her career, Carol served as an officer of the Money Marketeers and the Downtown Economists Club. She had a PhD from NYU's Stern School of Business. She lived in Brooklyn, New York, and had a weekend home on Long Island.
More Economy in Brief
 Global| Feb 05 2026
Charts of the Week: Balanced Policy, Resilient Data and AI Narratives
by:Andrew Cates


