 Global| Mar 10 2011
U.S. Flow of Funds Show Hesitant Gain in Credit Market Borrowing
Summary
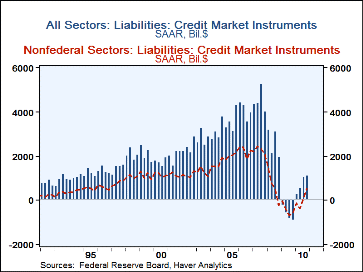
Credit market borrowing amounted to $1,111 billion, seasonally adjusted annual rate, in Q4. This extended a firming trend that lasted throughout 2010; the year cumulated to $736 billion in borrowing, reversing the net paydown of $634 [...]
 Credit market borrowing amounted to $1,111 billion, seasonally adjusted annual rate, in Q4. This extended a firming trend
that lasted throughout 2010; the year cumulated to $736 billion in borrowing, reversing the net paydown of $634 billion in 2009.
These data are from the Federal Reserve's flow-of-funds dataset, published today for Q4 and contained in Haver's
FFUNDS database. Aggregate revisions of Q3 data were modest.
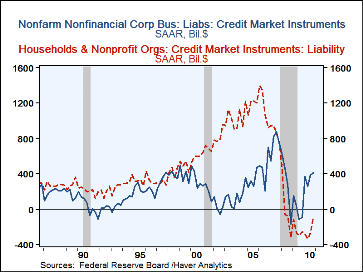
The federal government was still by far the largest user of credit market funds in Q4, but at $1,320 billion, the amount was actually a bit smaller than Q3's $1.396 billion -- all of these quarterly figures are quoted at seasonally adjusted annual rates. The year 2010 came to $1,580 billion, after $1,444 billion in 2009. The household sector continued to pay down on a net basis, but with "just" $78 billion, the liquidation was less than one-third the magnitude of the Q3 reduction, and the smallest since Q3 2008, right when the credit bubble was bursting. Small noncorporate businesses also paid down debt in Q4. Nonfinancial corporate business, by contrast, raised $413 billion in Q4, the fourth consecutive quarter of net borrowing since the credit crisis, and the largest. The year came to $355 billion, following the net reduction of $42 billion in 2009.
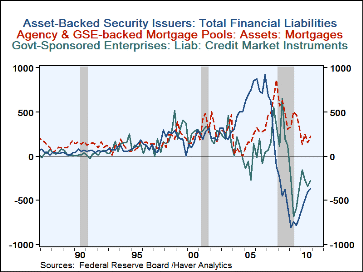
The financial sector, in contrast, contracted its own fund-raising again in Q4. Banks, GSEs, ABS issuers and so-called funding corporations all continued or returned to paying down their own borrowings. Note that these are all the sectors who were big players in the credit bubble of 2006-07, and they continue the "deleveraging" that must be endured to bring about the healing of the economy as a whole. A notable exception is the agency and GSE mortgage pools, that is, the issuers of standard plain mortgage-backed securities (MBS). They issued $220 billion of MBS in Q4; this brought the year total to $187 billion. At once the continued net issuance here is a good sign, but it is still the smallest yearly amount since 2005, as the housing market continues to languish.
Financial institutions as lenders had had an encouraging turn in Q3, returning to their usual status as net lenders.n Q4, this quickly reverted to net withdrawals of credit, by $472 billion from Q3's +$244 billion. The major turn seems to have come from U.S. branches of foreign banks, which cut their credit by $593 billion in Q4. Other financial lenders had mixed patterns of adds and withdrawals. A very small up-blip in one banking system line-item is actually the greatest highlight; commercial banking increased its standard "bank loans, n.e.c." lending activity by $16 billion, the first net increase in these bank loans since Q3 2008. The biggest borrowing sectors for these loans were small business and foreign banks; disappointingly, loans to corporate business fell again, although by a very small amount. Other forms of bank lending, such as mortgages and consumer credit, continued to contract.
So credit market activity remains slow and hesitant. But the Q4 report generally points to smaller contractions and early hints that credit growth may be returning. Unlike much historical experience, the turn toward growth is coming gradually, rather than having credit growth burst forth, clearly signaling sustainable rebound.
| Flow of Funds (SAAR, Bil.$) | Q4 '10 | Q3 '10 | Q2 '10 | Year | |||
|---|---|---|---|---|---|---|---|
| 2010 | 2009 | 2008 | 2007 | ||||
| Total Credit Market Borrowing | 1111 | 1038 | 526 | 736 | -634 | 2582 | 4483 |
| Federal Government | 1320 | 1396 | 2003 | 1580 | 1444 | 1239 | 237 |
| Households | -78 | -269 | -332 | -239 | -224 | -7 | 874 |
| Nonfinancial Corporate Business | 413 | 383 | 253 | 355 | -4 | 293 | 743 |
| Nonfarm, Noncorporate Business | -26 | -157 | -262 | -195 | -294 | 322 | 455 |
| Financial Sectors | -856 | -619 | -1046 | -964 | -1846 | 906 | 1799 |
Carol Stone, CBE
AuthorMore in Author Profile »Carol Stone, CBE came to Haver Analytics in 2003 following more than 35 years as a financial market economist at major Wall Street financial institutions, most especially Merrill Lynch and Nomura Securities. She had broad experience in analysis and forecasting of flow-of-funds accounts, the federal budget and Federal Reserve operations. At Nomura Securities, among other duties, she developed various indicator forecasting tools and edited a daily global publication produced in London and New York for readers in Tokyo. At Haver Analytics, Carol was a member of the Research Department, aiding database managers with research and documentation efforts, as well as posting commentary on select economic reports. In addition, she conducted Ways-of-the-World, a blog on economic issues for an Episcopal-Church-affiliated website, The Geranium Farm. During her career, Carol served as an officer of the Money Marketeers and the Downtown Economists Club. She had a PhD from NYU's Stern School of Business. She lived in Brooklyn, New York, and had a weekend home on Long Island.
More Economy in Brief
 Global| Feb 05 2026
Charts of the Week: Balanced Policy, Resilient Data and AI Narratives
by:Andrew Cates


