 Global| May 27 2010
U.S. GDP Growth Is RevisedSlightly Lower But Corporate Profits Jump, Again
by:Tom Moeller
|in:Economy in Brief
Summary
Growth in real GDP last quarter was revised slightly lower last quarter to 3.0% from 3.2% estimated in the advance report. A slowdown in the rate of inventory replenishment remained, however, the dominant piece of news, slowing the [...]
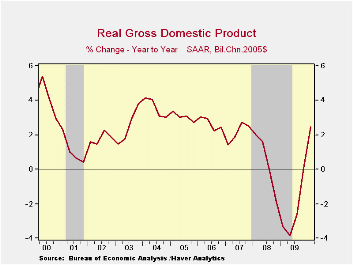
Growth in real GDP last quarter was revised slightly lower last quarter to 3.0% from 3.2% estimated in the advance report. A slowdown in the rate of inventory replenishment remained, however, the dominant piece of news, slowing the economy's growth from 5.6% during 4Q '09. Consensus expectations had been for a revision upward to 3.4% growth. Regardless, 1Q remained the third consecutive quarter of positive growth after the recession when GDP fell a postwar-record 3.7% peak-to-trough.
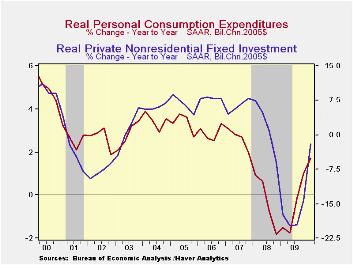
The largest piece of the downward revision was a reduced rate of growth in business fixed investment to a still-firm 3.1%. Growth in personal consumption and government spending also was reduced slightly. Finally, the contribution to growth from foreign trade was deepened somewhat. These revisions were mostly offset by slight upward revisions to inventory accumulation and residential investment.
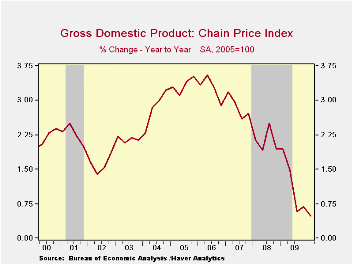
Price inflation was nudged up to a still-low 1.0% as measured by the chained GDP price index. The y/y gain of just 0.5% remained the lowest since the early-1950s. The personal consumption chain price index rose a reduced 1.5% but year-to-year prices increased an improved 2.0%, the quickest since 2008. The price index for fixed business investment fell 1.7% (-3.0% y/y), the fifth consecutive quarterly decline, but the residential investment price index rose for the second consecutive quarter (-1.0% y/y).
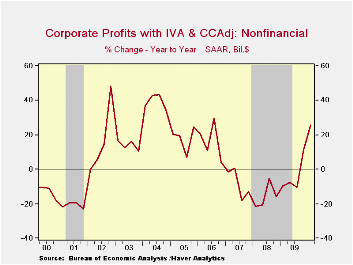
Released for the first time was the estimate of 1Q corporate profits. The 5.5% gain (31.0% y/y) was the sixth increase in the last seven quarters, a testimony to improved growth in the productivity of human capital and plant & equipment. Profits of U.S. nonfinancial companies grew 6.0% (25.7% y/y). The annual increase was the strongest since 2006. Financial sector profits grew a much-reduced 1.8% (77.2% y/y) while profits from abroad grew 9.6% (6.6% y/y).
| Chained 2005$, % AR | 1Q '10 (Preliminary) | 1Q '10 (Advance) | 4Q '09 | 3Q '09 | 1Q Y/Y | 2009 | 2008 | 2007 |
|---|---|---|---|---|---|---|---|---|
| GDP | 3.0 | 3.2 | 5.6 | 2.2 | 2.5 | -2.4 | 0.4 | 2.1 |
| Inventory Effect | 1.7 | 1.6 | 3.8 | 0.7 | 1.1 | -0.7 | -0.4 | -0.4 |
| Final Sales | 1.4 | 1.6 | 1.7 | 1.5 | 1.3 | -1.7 | 0.8 | 2.5 |
| Foreign Trade Effect | -0.7 | -0.6 | 0.3 | -0.8 | 0.2 | 1.0 | -1.2 | 0.8 |
| Domestic Final Demand | 2.0 | 2.2 | 1.4 | 2.3 | 1.2 | -2.7 | -0.4 | 1.7 |
| Personal Consumption | 3.5 | 3.6 | 1.6 | 2.8 | 1.7 | -0.6 | -0.2 | 2.7 |
| Business Fixed Investment | 3.1 | 4.0 | 5.3 | -5.9 | -2.0 | -17.8 | 1.6 | 6.2 |
| Residential Investment | -10.7 | -10.9 | 3.7 | 18.9 | -4.1 | -20.5 | -22.9 | -18.5 |
| Government Spending | -1.9 | -1.8 | -1.3 | 2.7 | 1.5 | 1.8 | 3.1 | 1.7 |
| Chained GDP Price Index | 1.0 | 0.9 | 0.5 | 0.4 | 0.5 | 1.2 | 2.1 | 2.9 |
by Tom Moeller May 27, 2010
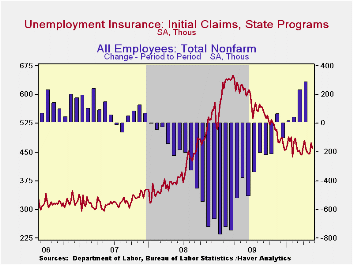
The labor market's improvement continues. That's the message from the Bureau of Labor Statistics report that initial claims for jobless insurance slipped 14,000 to 460,000 following last week's upwardly revised 28,000 increase. The latest disappointed Consensus expectations for a decline to 455,000 claims but claims remained near this cycle's lowest. Last week's figure was down from the recession peak of 651,000 reached in March of 2009. The four-week moving average of initial claims ticked up to 456,500.
A 49,000 decline in continuing claims for unemployment insurance during the latest week followed the prior week's 3,000 decline, which was less than reported initially. Claims were near the cycle low and down by one-third from the June '09 peak. The overall decline is a function of the improved job market but also reflects the exhaustion of 26 weeks of unemployment benefits. Continuing claims provide an indication of workers' ability to find employment. The four-week average of continuing claims at 4.637M remained near the cycle low. This series dates back to 1966.
Extended benefits for unemployment insurance rose further w/w to 278,953. However, they were down by roughly one-half from a peak of 597,688 reached in November.
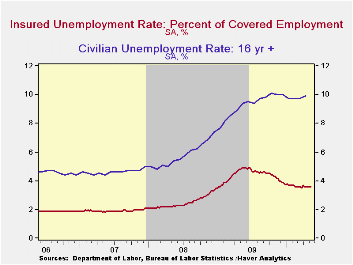
The insured unemployment rate remained at 3.6% where it has been since mid-February. The rate reached a high of 4.9% during May of 2009. During the last ten years, there has been a 96% correlation between the level of the insured unemployment rate and the overall rate of unemployment published by the Bureau of Labor Statistics.
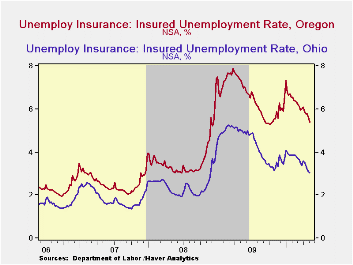
The highest insured unemployment rates in the week ending May 8 were in Puerto Rico (6.2 percent), Alaska (5.9), Oregon (5.4), Nevada (4.9), California (4.8), Pennsylvania (4.7), Wisconsin (4.5), North Carolina (4.4), Montana (4.3), and Connecticut (4.2). The lowest insured unemployment rates were in Virginia (1.8), Texas (2.1), Tennessee (2.6), Wyoming (2.7), Georgia (2.8), Maryland (2.9), Florida (3.0), Ohio (3.0), New York (3.3) and Maine (3.2). These data are not seasonally adjusted but the overall insured unemployment rate is.
The unemployment insurance claims data is available in Haver's WEEKLY database and the state data is in the REGIONW database.
Distortionary Fiscal Policy and Monetary Policy Goals from the Federal Reserve Bank of Kansas City is available here.
| Unemployment Insurance (000s) | 05/22/10 | 05/15/10 | 05/08/10 | Y/Y | 2009 | 2008 | 2007 |
|---|---|---|---|---|---|---|---|
| Initial Claims | 460 | 472 | 446 | -24.7% | 572 | 419 | 321 |
| Continuing Claims | -- | 4,607 | 4,656 | -29.1 | 5,809 | 3,340 | 2,549 |
| Insured Unemployment Rate (%) | -- | 3.6 | 3.6 | 4.9 (5/2009) | 4.4 | 2.5 | 1.9 |
by Robert Brusca May 27, 2010
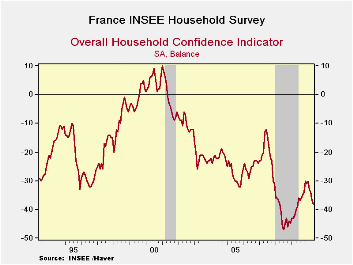 The Insee index of household confidence has dropped again marking the
fourth straight month of decline. This is not some garden variety
slippage in confidence from France. The four month drop marks a
cumulative drop of eight points in the index which is the 12th largest
four month decline in the series history. That makes the drop a top 5%
event. This not exactly what Europe is looking for in May.
The Insee index of household confidence has dropped again marking the
fourth straight month of decline. This is not some garden variety
slippage in confidence from France. The four month drop marks a
cumulative drop of eight points in the index which is the 12th largest
four month decline in the series history. That makes the drop a top 5%
event. This not exactly what Europe is looking for in May.
Until quite recently most European reports had been upbeat. But now there are some signs of erosion. The GFK German confidence index for June edged slightly lower on expectations decay. The UK CBI distributive trades index also reported today plunged sharply in May. Now in France the household confidence index that has been slipping has continued on that path.
Until now we had seen a fairly steady and strong recovery of economic data in the wake of the financial crisis. The MFG sector has been rebounding in Europe particularly strongly. The service sector has lagged. And the household sector has lagged even further. But in France it’s not a case of lagging but of the sector declining, backtracking.
The European economy is fighting off the remnants of recession and financial crisis with a new layering of financial crisis stemming from Greece’s problems, the knock effects to banks that hold European debt (substantially French and German banks) and the adverse market sentiment stemming from the need for fiscal austerity in Europe including France. It looks like the French consumer has figured out that the recovery will not be a bed of roses and maybe even that sector wide strikes that make such great theater in France will serve no purpose this time. The French consumer appears to be going down without a fight.
| INSEE Household Monthly Survey | |||||||
|---|---|---|---|---|---|---|---|
| Since Jan 1990 | |||||||
| May-10 | Apr-10 | Mar-10 | Feb-10 | Percentile | Rank % | Mean | |
| Household Confidence | -38 | -37 | -34 | -33 | 15.8 | 5.7 | -19 |
| Living Standards | |||||||
| past 12 Mos | -67 | -68 | -68 | -67 | 13.3 | 10.2 | -41 |
| Next 12-Mos | -53 | -48 | -43 | -37 | 9.2 | 4.1 | -22 |
| Unemployment: Next 12 | 62 | 63 | 63 | 58 | 77.3 | 83.7 | 33 |
| Price Developments | |||||||
| Past 12Mo | -20 | -18 | -25 | -26 | 30.8 | 56.7 | -16 |
| Next 12-Mos | -26 | -31 | -34 | -37 | 37.0 | 82.4 | -35 |
| Savings | |||||||
| Favorable to save | 14 | 17 | 18 | 20 | 43.2 | 19.2 | 22 |
| Ability to save Next 12 | -10 | -10 | -8 | -10 | 44.8 | 49.8 | -9 |
| Spending | |||||||
| Favorable for major purchase | -24 | -26 | -23 | -24 | 31.0 | 25.3 | -14 |
| Financial Situation | |||||||
| Current | 16 | 16 | 16 | 16 | 61.9 | 82.9 | 12 |
| Past 12 MOs | -25 | -25 | -24 | -25 | 35.5 | 13.9 | -17 |
| Next 12-Mos | -19 | -16 | -13 | -12 | 11.8 | 3.7 | -2 |
| Number of observations in the period | 245 | ||||||

Tom Moeller
AuthorMore in Author Profile »Prior to joining Haver Analytics in 2000, Mr. Moeller worked as the Economist at Chancellor Capital Management from 1985 to 1999. There, he developed comprehensive economic forecasts and interpreted economic data for equity and fixed income portfolio managers. Also at Chancellor, Mr. Moeller worked as an equity analyst and was responsible for researching and rating companies in the economically sensitive automobile and housing industries for investment in Chancellor’s equity portfolio. Prior to joining Chancellor, Mr. Moeller was an Economist at Citibank from 1979 to 1984. He also analyzed pricing behavior in the metals industry for the Council on Wage and Price Stability in Washington, D.C. In 1999, Mr. Moeller received the award for most accurate forecast from the Forecasters' Club of New York. From 1990 to 1992 he was President of the New York Association for Business Economists. Mr. Moeller earned an M.B.A. in Finance from Fordham University, where he graduated in 1987. He holds a Bachelor of Arts in Economics from George Washington University.
More Economy in Brief

 Global| Feb 05 2026
Charts of the Week: Balanced Policy, Resilient Data and AI Narratives
by:Andrew Cates

