 Global| Mar 26 2020
U.S. GDP Growth Remains at 2.1% in Q4
Summary
U.S. GDP was unrevised in the fourth quarter of 2019 at 2.1% (SAAR) the same as in the advance estimate and the February report. The latest number followed 3.1% in Q1 2019, 2.0% in Q2 and 2.1% in Q3, producing Q4/Q4 growth of 2.3% and [...]
U.S. GDP was unrevised in the fourth quarter of 2019 at 2.1% (SAAR) the same as in the advance estimate and the February report. The latest number followed 3.1% in Q1 2019, 2.0% in Q2 and 2.1% in Q3, producing Q4/Q4 growth of 2.3% and a total for 2019 as a whole of 2.3%. For Q4, the Action Economics Forecast Survey expected the unrevised 2.1% number.
Corporate profits for the fourth quarter were included in this report for the first time. After-tax profits without IVA and capital consumption adjustments grew 3.7% in the quarter and 4.1% from the quarter a year ago; these yielded just 0.3% for 2019 as a whole versus 2018. After-tax profits with IVA and CCAdj grew 2.1% in Q4 and 2.2% over Q4 2018; the total for 2019 was up just 0.1%. (These percentage changes for profits are quarterly, not annual rates.)
Fourth quarter growth in domestic final demand returned to the advance report's 1.6% (SAAR) from the 1.5% reported last month. Both personal consumption expenditures and business fixed investment contributed to the upward adjustment.
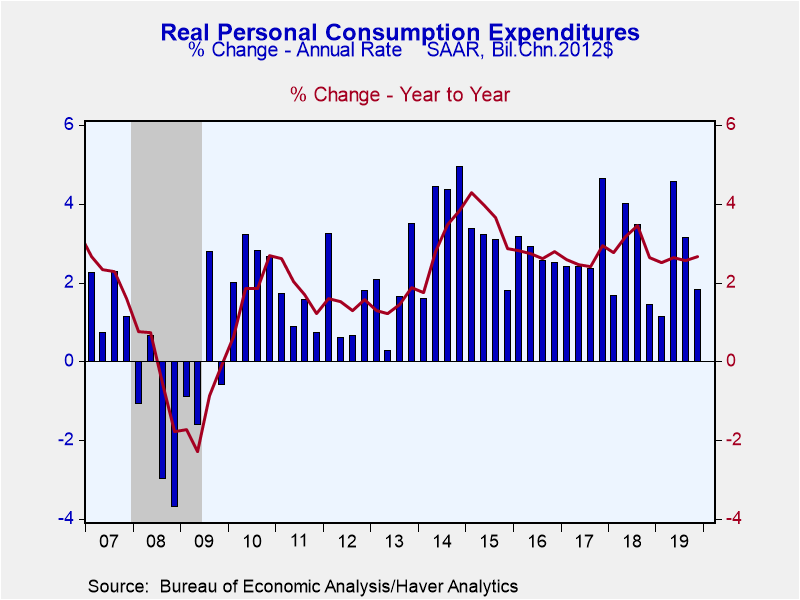
Personal consumption expenditures were revised up to 1.8% from last month's 1.7% with the y/y gain raised to 2.7% from 2.6% y/y. Spending growth on durable goods was raised to 2.8% (5.9% y/y) from 2.6%; that gain was most prominent in recreational goods & vehicles, which were lifted to 2.0% from 1.7%. Growth on expenditures for motor vehicles and furniture and appliances was unrevised at 5.5% (3.0% y/y) and 1.1% (4.5% y/y), respectively. Nondurable goods outlays 3.3% y/y) revised from -0.3% to -0.6% (+3.0% y/y), mainly due to a decline in gasoline and other energy products to -2.2% (-0.4% y/y) from -0.7% in last month's report. Apparel purchases were actually raised marginally to 4.9% (3.1% y/y) from 4.8%. Consumer spending on services was also raised in Q4 to 2.4% (2.1% y/y) from 2.2% before. Outlays on housing & utilities grew 0.4% (1.0% y/y)), up from 0.2% before, but spending growth at restaurants and hotels was further cut to just 0.4% (1.9%) from 1.3%. Growth was raised for transportation services to 0.7% (3.3% y/y) from 0.2%, and that for recreation was lifted to 5.5% (2.7%y/y) from 2.7%. Health care outlays were further strengthened to 4.9% (3.8% y/y) from 3.8% in last month's report.
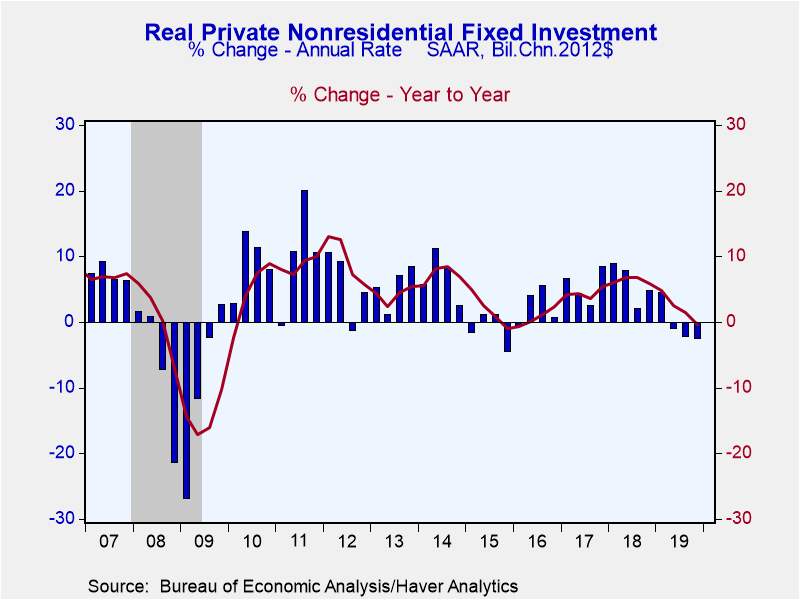
Business fixed investment, already weak, was trimmed to -2.4% from last month's -2.3% rate and down y/y by 0.4%. Buildings were still the weakest component but they were adjusted upward to -7.2% (-6.2% y/y) from -8.1% before. The decline in equipment investment was also reduced a bit, to -4.3% from -4.4% (-1.9% y/y). Intellectual property product investment was the source of the reduction in total business investment; it is now shown up 2.8% from 4.0% in Q4, cutting the y/y change to just 5.4%, the slowest since early 2018.
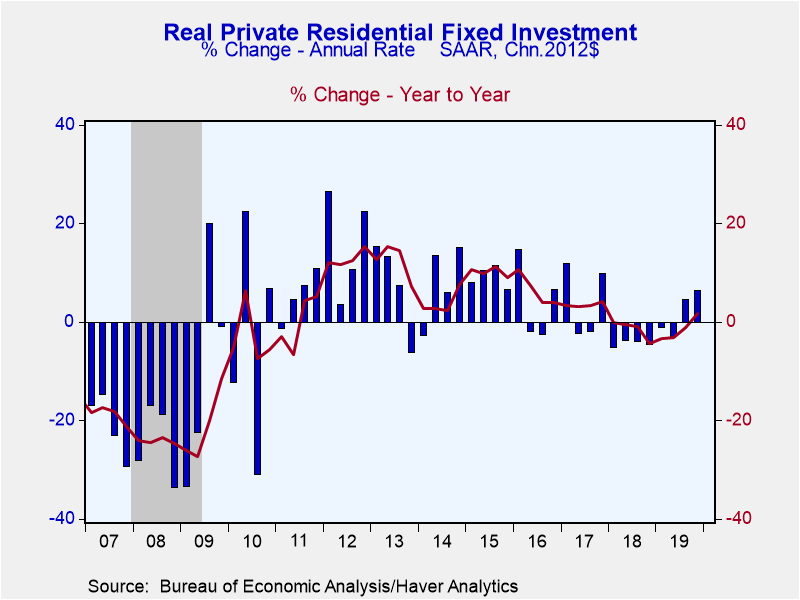
Residential investment was lifted to 6.5% growth in Q4 from 6.1% reported before and up 1.7% y/y. This is the first year-on-year improvement since the end of 2017.
Government spending growth was 2.5% (3.0% y/y), marginally less than last month's 2.6% report. Federal government purchases were cut to 3.4% growth (4.3% y/y) from 3.8% (4.4% y/y); the reduction was in defense outlays, now shown at 4.4% growth (also 4.4% y/y) instead of the 5.3% in last month's compilation. During all of 2019, defense spending is still seen as up 4.9%, the strongest growth in ten years and improved from declines early in the decade. Nondefense outlays rose at a 1.9% pace in Q4, up 4.1% y/y and 1.6% for all of 2019. State & local expenditures were up at a 2% pace in the quarter, putting the y/y gain for Q4 at 2.2% and the whole year at 1.6%.
The change in business inventories was marginally revised to $13.1 billion in Q4 from $13.0 billion reported last month. Q3 had seen accumulation of $69.4 billion so the current amount still subtracts 1 percentage point from total GDP growth. There was also a marginal revision to net exports, which are now seen at -$900.7 billion in Q4 from -$899.6 billion last month. This still added 1.5 percent to GDP, following the -$990.1 billion deficit in Q3. Exports of goods & services were unchanged at a 2.1% (0.3% y/y) gain in Q4 while imports declined at an 8.4% pace (-2.1% y/y).
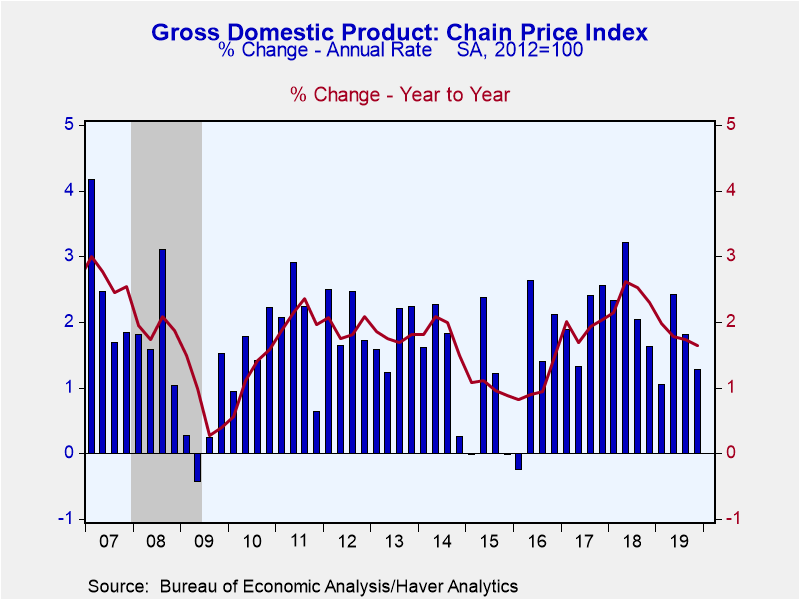
The GDP price index was unchanged with a 1.3% annualized increase in Q4 (1.6% y/y). This was anticipated in the Action Economics Forecast Survey. The PCE price index was edged higher to a 1.4% pace of increase from the 1.3% in last month's report but was unchanged in the y/y calculation at 1.4%. PCE prices excluding food & energy were raised to 1.3% from last month's 1.2%; the y/y increase was 1.46% The change in the business fixed investment price index was cut back modestly to 0.4% (1.1% y/y) from 0.5% last month. The residential investment price index was reduced slightly to a 2.4% pace of increase from 2.6% reported last month; the y/y move is now shown at 2.5%, down from 2.6% last month.
The GDP figures can be found in Haver's USECON and USNA database. USNA contains virtually all of the Bureau of Economic Analysis' detail in the national accounts. Both databases include tables of the newly published not seasonally adjusted data. The Action Economics consensus estimates can be found in AS1REPNA.
| Chained 2012 $ (%, AR) |
|
Q4'19 (Advance Estimate) | Q3'19 | Q2'19 | Q4'19 Y/Y | 2019 | 2018 | 2017 |
|---|---|---|---|---|---|---|---|---|
| Gross Domestic Product | 2.1 | 2.1 | 2.1 | 2.0 | 2.3 | 2.3 | 2.9 | 2.4 |
| Inventory Effect (%-point) | -1.0 | -1.1 | 0.0 | -0.9 | -0.4 | 0.1 | 0.1 | 0.1 |
| Final Sales | 3.2 | 3.2 | 2.1 | 3.0 | 2.7 | 2.2 | 2.8 | 2.3 |
| Foreign Trade Effect (%-point) | 1.5 | 1.5 | -0.1 | -0.7 | 0.4 | -0.1 | -0.2 | -0.2 |
| Domestic Final Sales | 1.6 | 1.6 | 2.2 | 3.6 | 2.3 | 2.3 | 3.0 | 2.5 |
| Personal Consumption Expenditure | 1.8 | 1.8 | 3.1 | 4.6 | 2.7 | 2.6 | 3.0 | 2.6 |
| Nonresidential Fixed Investment | -2.4 | -1.5 | -2.3 | -1.0 | -0.4 | 2.1 | 6.4 | 4.4 |
| Residential Investment | 6.5 | 5.8 | 4.6 | -2.9 | 1.7 | -1.5 | -1.5 | 3.5 |
| Government Spending | 2.5 | 2.7 | 1.7 | 4.8 | 3.0 | 2.3 | 1.7 | 0.7 |
| Chain-Type Price Index | ||||||||
| GDP | 1.3 | 1.4 | 1.8 | 2.4 | 1.4 | 1.8 | 2.4 | 1.9 |
| Personal Consumption Expenditure | 1.4 | 1.6 | 1.5 | 2.4 | 1.4 | 1.4 | 2.1 | 1.8 |
| Less Food & Energy | 1.3 | 1.3 | 2.1 | 1.9 | 1.6 | 1.6 | 1.9 | 1.6 |
| Nonresidential Investment | 0.4 | -0.2 | 0.5 | 2.0 | 1.2 | 1.2 | 1.4 | 1.0 |
| Residential Investment | 2.4 | 2.7 | 3.4 | 1.7 | 2.6 | 2.9 | 5.6 | 4.5 |
Carol Stone, CBE
AuthorMore in Author Profile »Carol Stone, CBE came to Haver Analytics in 2003 following more than 35 years as a financial market economist at major Wall Street financial institutions, most especially Merrill Lynch and Nomura Securities. She has broad experience in analysis and forecasting of flow-of-funds accounts, the federal budget and Federal Reserve operations. At Nomura Securites, among other duties, she developed various indicator forecasting tools and edited a daily global publication produced in London and New York for readers in Tokyo. At Haver Analytics, Carol is a member of the Research Department, aiding database managers with research and documentation efforts, as well as posting commentary on select economic reports. In addition, she conducts Ways-of-the-World, a blog on economic issues for an Episcopal-Church-affiliated website, The Geranium Farm. During her career, Carol served as an officer of the Money Marketeers and the Downtown Economists Club. She has a PhD from NYU's Stern School of Business. She lives in Brooklyn, New York, and has a weekend home on Long Island.


