 Global| Oct 17 2019
U.S. Housing Retreats from 12-Year High
Summary
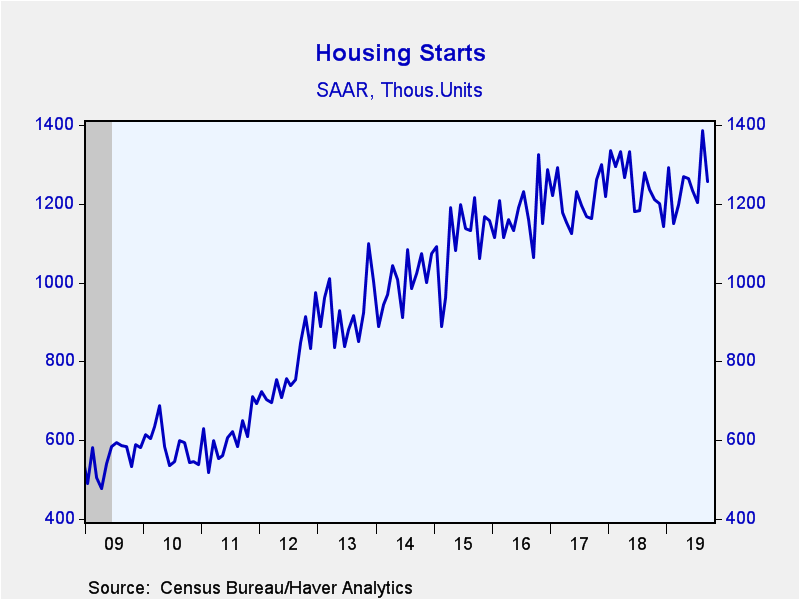
Building activity retraced some of last month's strength. Housing starts fell a greater-than-expected 9.4% in September (+1.6% year-on-year) to 1.256 million-unit annual rate, from an upwardly-revised 1.386 million in August. The [...]
Building activity retraced some of last month's strength. Housing starts fell a greater-than-expected 9.4% in September (+1.6% year-on-year) to 1.256 million-unit annual rate, from an upwardly-revised 1.386 million in August. The August reading was the strongest pace since June 2007; though starts remain well below their January 2006 peak of 2.273 million. The Action Economics Forecast Survey expected 1.316 million starts during September.
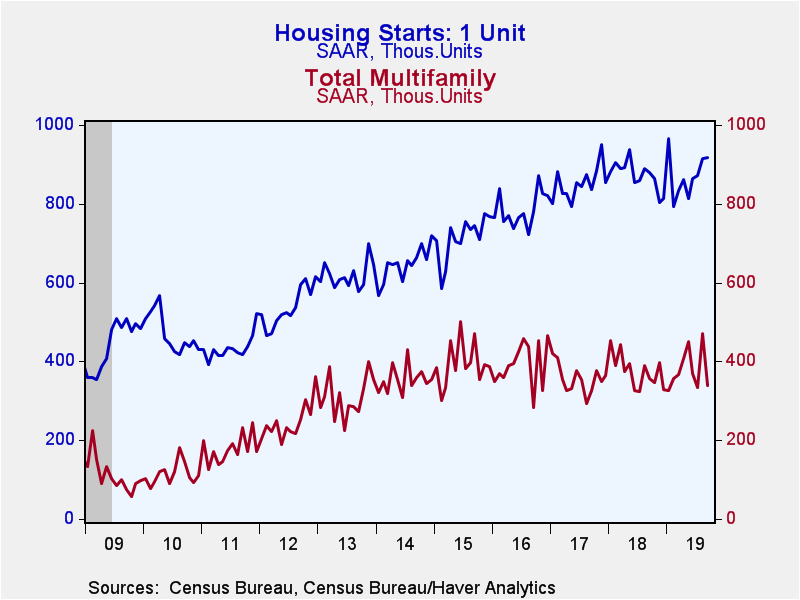
A 28.2% drop in volatile multi-family starts drove the decline (-5.1% y/y). However, this followed a 41.4% jump in August and left activity multi-family sector slightly above its July level, but at the low end of the range it has been for the last two years. Meanwhile, single family starts edged up 0.3% in September (4.3% y/y), though still remain below the 11.5 year high reached this January.
Starts fell in all regions in September led by a 34.3% drop in the Northeast (-22.1% y/y). The Midwest fell 18.9% (-2.3% y/y). Starts declined 4.0% in the South (+18.6% y/y) and 1.9% in the West (-14.4%).
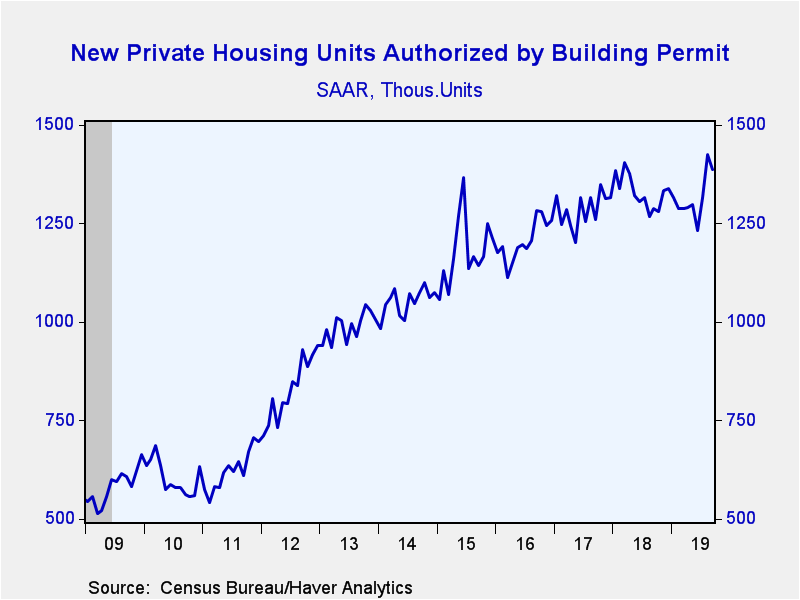
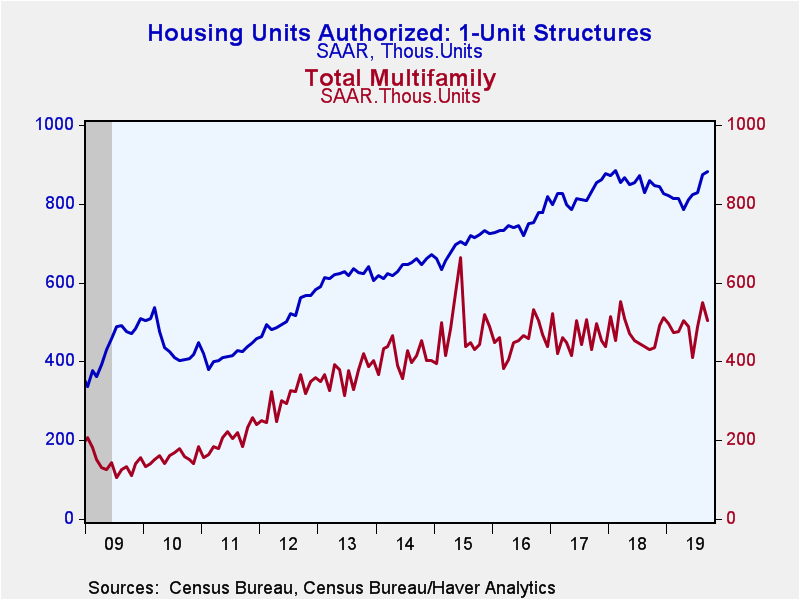
In contrast to starts, while building permits decreased they remained at an elevated level. Total permits declined 2.7% last month (+7.7% y/y) to 1.387 million from an upwardly-revised 1.425 million pace. Permits to build multi-family homes dropped 8.2% (+17.4% y/y) while single-family permits rose 0.8% (2.8% y/y).
The housing starts and permits figures can be found in Haver's USECON database. The expectations figure is contained in the AS1REPNA database.
The Fed's latest Beige Book covering regional economic conditions is available here.
| Housing Starts (000s, SAAR) | Sep | Aug | Jul | Sep Y/Y % | 2018 | 2017 | 2016 |
|---|---|---|---|---|---|---|---|
| Total | 1,256 | 1,386 | 1,204 | 1.6 | 1,250 | 1,209 | 1,178 |
| Single-Family | 918 | 915 | 871 | 4.3 | 873 | 852 | 786 |
| Multi-Family | 338 | 471 | 333 | -5.1 | 377 | 357 | 392 |
| Starts By Region | |||||||
| Northeast | 109 | 166 | 96 | -22.1 | 111 | 111 | 116 |
| Midwest | 167 | 206 | 173 | -2.3 | 171 | 181 | 185 |
| South | 676 | 704 | 618 | 18.6 | 631 | 603 | 585 |
| West | 304 | 310 | 317 | -14.4 | 337 | 314 | 292 |
| Building Permits | 1,387 | 1,425 | 1,317 | 7.7 | 1,330 | 1,286 | 1,207 |
Gerald D. Cohen
AuthorMore in Author Profile »Gerald Cohen provides strategic vision and leadership of the translational economic research and policy initiatives at the Kenan Institute of Private Enterprise.
He has worked in both the public and private sectors focusing on the intersection between financial markets and economic fundamentals. He was a Senior Economist at Haver Analytics from January 2019 to February 2021. During the Obama Administration Gerald was Deputy Assistant Secretary for Macroeconomic Analysis at the U.S. Department of Treasury where he helped formulate and evaluate the impact of policy proposals on the U.S. economy. Prior to Treasury, he co-managed a global macro fund at Ziff Brothers Investments.
Gerald holds a bachelor’s of science from the Massachusetts Institute of Technology and a Ph.D. in Economics from Harvard University and is a contributing author to 30-Second Money as well as a co-author of Political Cycles and the Macroeconomy.
More Economy in Brief
 Global| Feb 05 2026
Charts of the Week: Balanced Policy, Resilient Data and AI Narratives
by:Andrew Cates


