 Global| Jan 22 2009
U.S. Housing Starts At Record Low
by:Tom Moeller
|in:Economy in Brief
Summary
The pace of the downturn in the U.S. housing market accelerated at the end of last year. Housing starts fell to a record low in December of 550,000 units (SAAR) which was the lowest in the series' history that extends back to 1959. [...]
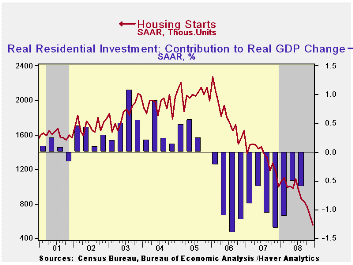
The pace of the downturn in the U.S. housing market accelerated at the end of last year. Housing starts fell to a record low in December of 550,000 units (SAAR) which was the lowest in the series' history that extends back to 1959. November starts were revised slightly higher and Consensus expectations for December were for 608,000 starts.
Not only were the latest figures at their historic low but the rate of decline had been accelerating all year to the point where starts during 4Q were one quarter below the 3Q level. That is more than double the 3Q rate of decline and also the fastest on record.
Starts of single-family homes fell to their record low of 398,000 from an upwardly revised November. The level is down by three-quarters since the peak in early 2006. During the last three months, the annual rate of decline reached 72.8%. Permits to build single-family homes also fell to their record low, off by nearly one-third during the last three months. During the last ten years there has been an 84% correlation between the q/q change in single-family starts and their contribution to quarterly GDP growth.
Starts of multi-family homes fell 20.4% in November alone to
their lowest level since early-1994. They are down by one-third since
December 2007.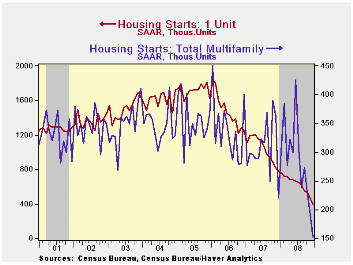
By region, December starts of single-family units in the Midwest were the weakest last month. They were off by more than one-quarter from November and by nearly fifty percent year-to-year. Starts in the West fell 22.7% from November and they were also down by one-half from December of 2007. In the South starts fell by a lesser 9.7% during December. They too were off by one-half from their December 2007 level. In the Northeast starts actually posted a slight uptick during December but they were down by one-third from the year ago level.
Economic Outlook Symposium: Summary of 2008 results and forecasts for 2009 from the Federal Reserve Bank of Chicago can be found here.
| Housing Starts (000s, SAAR) | December | November | October | Y/Y | 2008 | 2007 | 2006 |
|---|---|---|---|---|---|---|---|
| Total | 550 | 651 | 767 | -45.0% | 902 | 1,341 | 1,812 |
| Single-Family | 398 | 460 | 536 | -43.9 | 618 | 1,034 | 1,474 |
| Multi-Family | 152 | 191 | 231 | -31.2 | 285 | 307 | 338 |
| Building Permits | 549 | 615 | 730 | -50.6 | 880 | 1,389 | 1,844 |
by Tom Moeller January 22, 2009
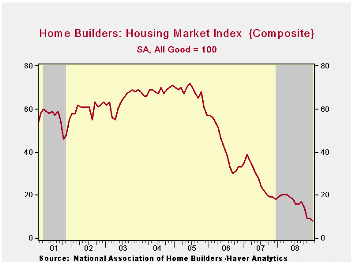
The January Housing Market Index (HMI) from the National
Association of Home Builders again reached a record low. At a level of
8 it was more than half below the year-ago figure. The index is
compiled from survey questions asking builders to rate market
conditions as “good”, “fair”, “poor” or “very high” to “very low”.
Numerical results over 50 indicate a predominance of
“good” readings. 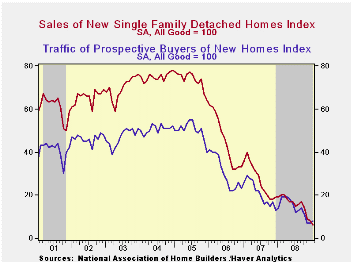
Since 1990, the year-to-year change in this index has had a correlation of 72% with the year-to-year percentage change in new single-family home sales.
The Home Builders Association indicated that its sub-index of present sales conditions also fell to a record low of 6. That was down from last year's average level of 16, 2007's average of 27, 2006's average of 45 and 2005's average of 73.
Builders’ expectations for sales in six months ticked up slightly month-to-month to a level of 17 but that remained down sharply from prior years. The “traffic" of prospective buyers also ticked up slightly from the record low reached in December.
Index readings were mixed last month in the country's regions. In the West the index fell hard month-to-month to a new low. It was down slightly in the Northeast, stable month-to-month in the Midwest and up in the South. Year-to-year, the sharpest decline was in the West.
Not only are builders disturbed by the market for new homes, but the assessment of conditions for remodeling a home also reached a record low during the third quarter. Expectations also fell to a record low.
The NAHB has compiled the Housing Market Index since 1985. The weights assigned to the individual index components are .5920 for single family detached sales, present time; .1358 for single family detached sales, next six months; and .2722 for traffic of prospective buyers. The results, along with other housing and remodeling indexes from NAHB Economics, are included in Haver’s SURVEYS database.
The Yield Curve, January 2009 from the Federal Reserve Bank of Cleveland is available here.
| Nat'l Association of Home Builders | January | December | January '08 | 2008 | 2007 | 2006 |
|---|---|---|---|---|---|---|
| Composite Housing Market Index | 8 | 9 | 19 | 16 | 27 | 42 |
by Tom Moeller January 22, 2009
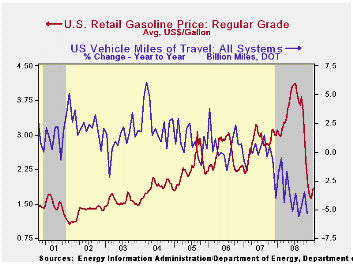
Regular gasoline prices moved higher last week for the third consecutive period. They rose six cents to an average $1.85 per gallon after the prior week's ten cent gain, according to the U.S. Department of Energy survey. The latest level was the highest price since late November. Yesterday, the spot market price for regular gasoline was up again to $1.20 per gallon which was its highest level since late-November.
Weekly gasoline prices can be found in Haver's WEEKLY
database. Daily prices are in the DAILY
database.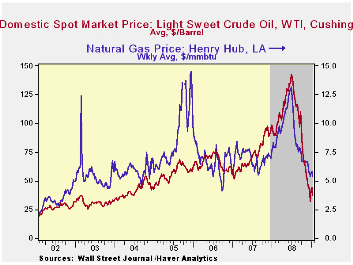
Demand continued quite weak for gasoline in reaction to the economy's weakness. The U.S. Department of Energy reported that the demand for gasoline fell by 3.9% during the latest four weeks, nearly the fastest rate of decline since late-1995 (the latest four weeks versus the same four weeks in 2008). The demand for all petroleum products also fell sharply, by 4.0%. These numbers are available in Haver's OILWKLY database.
The source for that reduced demand for gasoline is the cutback in vehicle miles driven which have fallen 3.5% during the twelve months ended October. The decline of roughly this magnitude, sustained as it has been for most of last year, is unprecedented. These Department of Transportation figures are available in Haver's OGJ database.
The price for a barrel of West Texas Intermediate crude oil retraced most of the gains during the prior two weeks and fell to $36.91 per barrel. Prices reached their high of $145.66 last July. In futures trading yesterday, the one-month price for crude oil moved back up to $43.55.
Last week, prices for natural gas slipped to $5.40 per mmbtu (-35.0% y/y). The latest average price was almost 50% below natural gas prices in early-July of $13.19/mmbtu.
Understanding Monetary Policy Implementation from the Federal Reserve Bank of Richmond can be found here.
| Weekly Prices | 01/19/09 | 01/12/09 | Y/Y | 2008 | 2007 | 2006 |
|---|---|---|---|---|---|---|
| Retail Regular Gasoline ($ per Gallon) | 1.85 | 1.78 | -38.8% | 3.25 | 2.80 | 2.57 |
| Light Sweet Crude Oil, WTI ($ per bbl.) | 36.91 | 44.51 | -59.7% | 100.16 | 72.25 | 66.12 |
by Tom Moeller January 22, 2009
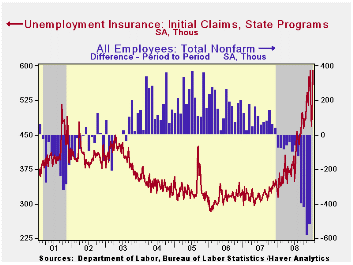
At 589,000 last week, initial claims for unemployment
insurance rose another 62,000 to their highest level since late during
the sharp recession of 1981-82. During that recession, real GDP fell by
2.9% peak-to-trough. The latest increase in initial claims followed a
57,000 increase during the prior period and it exceeded Consensus
expectations for a rise to 548,000.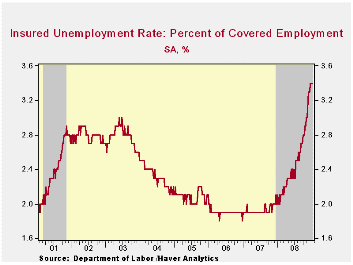
The latest initial claims figure is for the January survey period for nonfarm payrolls and claims were up 5.9% from the December period. During the last ten years there has been a negative 84% correlation between the level of claims and the month-to-month change in nonfarm payrolls.
The Labor Department indicated that the largest increases in initial claims for the week ending January 10 were in Michigan (+34,639), California (+22,573), Florida (+20,658), North Carolina (+15,637), and Pennsylvania (+13,848), while the largest decreases were in South Carolina (-2,682), Massachusetts (-1,882), New York (-1,852), Iowa (-1,593), and Oregon (-856).
Continuing claims for unemployment insurance during the week of January 10 recovered nearly all of the prior week's decline with a 97,000 increase. That also lifted continuing claims to their highest since late 1982. The four-week average of continuing claims rose 58,800 to 4,559,750. Continuing claims provide some indication of workers' ability to find employment and they lag the initial claims figures by one week.
The insured rate of unemployment remained stable for the fourth week at this cycle's high of 3.4%, the highest since 1983. The highest insured unemployment rates in the week ending January 3 were in Michigan (7.5 percent), Oregon (7.5), Idaho (6.7), Wisconsin (6.7), Pennsylvania (6.6), Indiana (5.7), Kentucky (5.7), North Carolina (5.7), South Carolina (5.6), and Rhode Island (5.5).
The Tech Pulse Index: Recent Trends in Tech-Sector Activity from the Federal Reserve Bank of San Francisco is available here.
| Unemployment Insurance (000s) | 01/17/09 | 01/10/09 | 01/03/09 | Y/Y | 2008 | 2007 | 2006 |
|---|---|---|---|---|---|---|---|
| Initial Claims | 589 | 527 | 470 | 81.8% | 420 | 321 | 313 |
| Continuing Claims | -- | 4,607 | 4,510 | 71.8% | 3,342 | 2,552 | 2,459 |
by Robert Brusca January 22, 2009
E-Zone orders are dropping sharply in November. Based on some
more topical country level reports, it is not surprising that the EMU
orders series made another sharp fall – and more those lie ahead.
Today, in fact, the UK CBI survey of industry posted another sharply
weaker result with its up minus down diffusion index falling to -48 in
January compared to -35 in December. That’s right, in January.
Diffusion data are generally out a month or more ahead of the actual
underlying series that they describe and, as such, they provide a road
map of where we are headed. Still, the variables themselves tell the
actual story of industry.
In November the EMU series is telling us of increased pain in
the zone. The carnage is widespread. For Germany, France, Italy and the
UK Yr/Yr orders are dropping in November by 20% or more from November
of one year ago. In the quarter to date (Q4) the country level growth
rates for orders are more like a negative 50% at an annual rate
compared to Q3 2008.
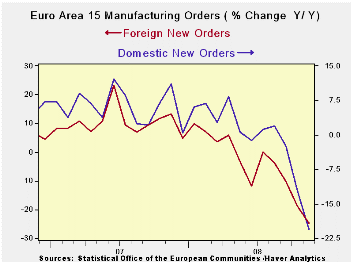
The weakness is spread more or less equally across domestic
and foreign orders in the EMU series. Foreign orders are down by more
over 12-months but the drop in November is worse for domestic orders.
For the moment we are in the worst of the grip of the
downturn. As we admit this, the international banking crisis is not
getting any better. The ‘Dutch boys’ with their fingers in the dikes
are calling out for more recruits --for more stop-gap plans. Others are
crying out for a more permanent solution and for mindful attention to
what all this interventionism will mean for the future. The US has just
completed its transition to new leadership. Japan is eroding faster
after showing some resilience. The strength in the yen is finally
creating more distress there. The data from the industrial sector in
EMU are telling. The pressure on the financial sector is bad and it is
going to get worse. We were already in a financial mess before this
recession began. Now the recession is global in nature and it is going
to spawn and spread the usual credit mess that comes hand in hand with
recession- and this recession is severe. So be prepared, because things
will get worse... That is the main message from the day’s weak
industrial data in Europe.
| E-zone-13 and UK Industrial Orders And Sales | |||||||||
|---|---|---|---|---|---|---|---|---|---|
| Saar except m/m | Mo/Mo | Nov-08 | Oct-08 | Nov-08 | Oct-08 | Nov-08 | Oct-08 | ||
| Ezone Detail | Nov-08 | Oct-08 | Sep-08 | 3-Mo | 3-Mo | 6-mo | 6-mo | 12-mo | 12-mo |
| MFG Orders | -4.5% | -5.7% | -5.4% | -47.3% | -40.3% | -27.6% | -28.3% | -21.0% | -15.2% |
| MFG Sales | -0.9% | -1.9% | -1.9% | -17.0% | -17.0% | -10.5% | -8.6% | -2.6% | -1.7% |
| Consumer | 0.1% | 0.0% | -0.2% | -0.3% | -1.4% | -0.7% | -1.2% | -0.5% | -0.6% |
| Capital | -0.3% | -0.6% | -0.6% | -5.8% | -6.7% | -5.3% | -5.2% | -1.5% | -1.2% |
| Intermediate | -7.0% | -5.5% | -6.0% | -53.6% | -38.7% | -28.6% | -26.9% | -20.5% | -12.2% |
| Memo:MFG | |||||||||
| Total Orders | -4.5% | -5.7% | -5.4% | -47.3% | -40.3% | -27.6% | -28.3% | -21.0% | -15.2% |
| E-13 Domestic MFG orders | -7.0% | -5.5% | -6.0% | -53.6% | -38.7% | -28.6% | -26.9% | -20.5% | -12.2% |
| E-13 Foreign MFG orders | -3.5% | -6.9% | -5.9% | -48.9% | -46.5% | -30.3% | -32.3% | -24.8% | -18.9% |
| Countries: | Nov-08 | Oct-08 | Sep-08 | 3-Mo | 3-Mo | 6-mo | 6-mo | 12-mo | 12-mo |
| Germany (MFG): | -7.2% | -7.1% | -8.0% | -60.3% | -39.7% | -37.5% | -29.6% | -24.4% | -16.6% |
| France(Ind): | -5.7% | -11.8% | 0.6% | -50.8% | -55.2% | -33.7% | -38.5% | -25.5% | -18.8% |
| Italy (Ind): | -6.3% | -6.6% | -3.8% | -49.7% | -39.0% | -27.2% | -23.2% | -21.1% | -12.1% |
| UK (Engineering Ind): | -8.4% | -24.0% | 28.8% | -35.6% | -35.3% | -38.9% | -35.2% | -21.7% | -8.9% |

Tom Moeller
AuthorMore in Author Profile »Prior to joining Haver Analytics in 2000, Mr. Moeller worked as the Economist at Chancellor Capital Management from 1985 to 1999. There, he developed comprehensive economic forecasts and interpreted economic data for equity and fixed income portfolio managers. Also at Chancellor, Mr. Moeller worked as an equity analyst and was responsible for researching and rating companies in the economically sensitive automobile and housing industries for investment in Chancellor’s equity portfolio. Prior to joining Chancellor, Mr. Moeller was an Economist at Citibank from 1979 to 1984. He also analyzed pricing behavior in the metals industry for the Council on Wage and Price Stability in Washington, D.C. In 1999, Mr. Moeller received the award for most accurate forecast from the Forecasters' Club of New York. From 1990 to 1992 he was President of the New York Association for Business Economists. Mr. Moeller earned an M.B.A. in Finance from Fordham University, where he graduated in 1987. He holds a Bachelor of Arts in Economics from George Washington University.
More Economy in Brief


