 Global| May 01 2006
U.S. Income, Spending & Prices Firm in March
by:Tom Moeller
|in:Economy in Brief
Summary
Personal income increased 0.8% during March, double the Consensus expectation for a 0.4% rise and followed an unrevised 0.3% increase in February. The increase was the largest for any month since last September. A 5.3% (16.4% y/y) [...]
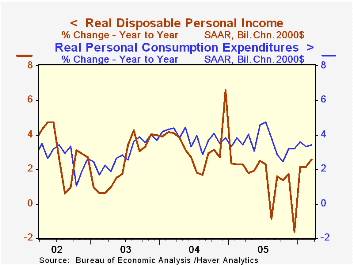
Personal income increased 0.8% during March, double the Consensus expectation for a 0.4% rise and followed an unrevised 0.3% increase in February. The increase was the largest for any month since last September.
A 5.3% (16.4% y/y) spike in health insurance benefits due to prescription drug benefits under the Medicare health-care program boosted transfer payments by 3.3% (9.3% y/y).
Wage & salary disbursements rose another 0.4% (5.0% y/y) lifted by a 0.5% (5.6% y/y) rise in private service sector wages. Factory wages rose 0.3% (2.4% y/y), the firmest gain since last October, while government sector wages grew 0.3% (3.3% y/y).
Disposable personal income jumped 0.8% (5.5% y/y) while personal taxes rose 0.8% (9.3% y/y). Adjusted for price inflation disposable income rose 0.5% (2.6% y/y) and real disposable income per capita jumped 0.4% (1.6% y/y).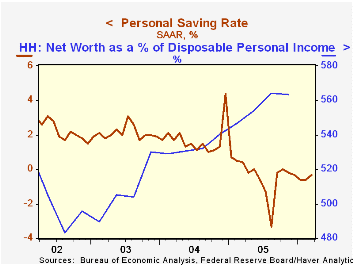
Personal consumption also was firm and increased 0.6% versus a Consensus expectation for a 0.4% rise. Adjusted for price inflation, spending rose 0.2% (3.4% y/y). Real spending on furniture & household equipment increased 0.9% (13.0% y/y) and "other" durable goods spending rose 1.8% (8.5% y/y). Spending on clothing & shoes fell for the second consecutive month and drooped 0.9% (+7.8% y/y) following several strong monthly gains between October and January. Spending on gasoline & oil fell 2.9% (-0.2% y/y and real services spending rose 0.4% (3.0% y/y).
The PCE chain price index rose 0.4% lifted by a 3.5% (16.5% y/y) jump in gasoline & oil prices. Prices for clothing & shoes surged 1.2% (-1.8% y/y), furniture & household equipment prices fell another 0.3% (-4.5% y/y) but motor vehicle & parts prices rose 0.2% (0.8% y/y).
Incentives and Prices for Motor Vehicles: What has been happening in recent years? is a Working Paper from the Federal Reserve Board and is available here.
The personal savings rate was a negative 0.3%.
Last week's testimony, Outlook for the U.S. Economy, by Federal Reserve Bank Chairman Ben S. Bernanke can be found here.
| Disposition of Personal Income | Mar | Feb | Y/Y | 2005 | 2004 | 2003 |
|---|---|---|---|---|---|---|
| Personal Income | 0.8% | 0.3% | 6.0% | 5.5% | 5.9% | 3.2% |
| Personal Consumption | 0.6% | 0.2% | 6.4% | 6.5% | 6.5% | 4.9% |
| Savings Rate | -0.3% | -0.6% | 0.4% (Mar '05) | -0.4% | 1.7% | 2.1% |
| PCE Chain Price Index | 0.4% | 0.1% | 2.9% | 2.8% | 2.6% | 1.9% |
| Less food & energy | 0.3% | 0.1% | 2.0% | 2.0% | 2.0% | 1.3% |
by Tom Moeller May 1, 2006
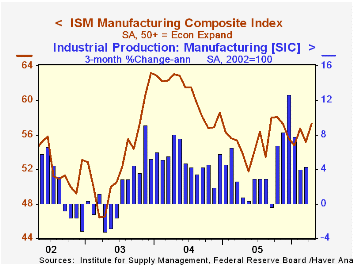
The April Composite Index of activity in the factory sector reported by the Institute of Supply Management (ISM) surged to 57.3, well ahead of Consensus expectations for an unchanged reading at 55.0. The figure was the highest since last November and represented improvement from the 1Q average of 55.6.
During the last twenty years there has been a 68% correlation between the level of the Composite Index and the three month growth in factory sector industrial production.
A higher production index at 60.4 versus 57.2 averaged during 1Q led last month's rise. Moreover, the employment index rebounded to 55.8 versus 52.9 during 1Q. During the last twenty years there has been a 67% correlation between the level of the ISM employment Index and the three month growth in factory sector employment. The inventory index also rose to its highest level (51.3) in a year while the supplier deliveries index increased to its highest (57.7) since October.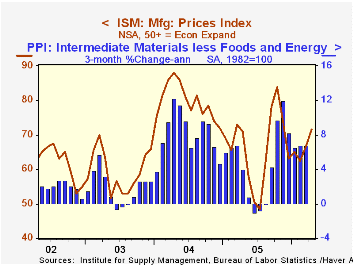
To the downside was the new orders index which fell to the lowest level (57.6) since August. New export orders were notably weak as the index dropped to the lowest level (53.4) since last June.
The price index showed further strength with a five point increase to its highest level since November. During the last twenty years there has been a 91% correlation between the price index and the three month change in the PPI for intermediate goods less food & energy.
Are We Engineering Ourselves Out of Manufacturing Jobs? from the Federal Reserve Bank of Cleveland can be found here.
| ISM Manufacturing Survey | April | Mar | April '05 | 2005 | 2004 | 2003 |
|---|---|---|---|---|---|---|
| Composite Index | 57.3 | 55.2 | 53.8 | 55.5 | 60.5 | 53.3 |
| New Orders Index | 57.6 | 58.4 | 54.7 | 57.4 | 63.5 | 57.9 |
| Prices Paid Index (NSA) | 71.5 | 66.5 | 71.0 | 66.4 | 79.8 | 59.6 |
by Tom Moeller May 1, 2006
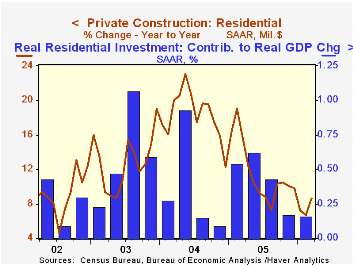
The March value of construction put in place increased another 0.9% on top of the 1.0% rise during February and for the second month, the gain was double the Consensus expectation for a 0.4% increase.
Residential building jumped 1.6% after an unrevised 1.3% February surge. Strength was most pronounced in the value of improvements which jumped 4.5% (-7.0% y/y) while new single family building rose 0.5% (13.5% y/y).
Nonresidential building fell 0.1%, the first decline since last October, and it was led by a 1.7% (+11.2% y/y) drop in office construction. Commercial building rose 0.6% (8.7% y/y) after a huge 3.3% February drop.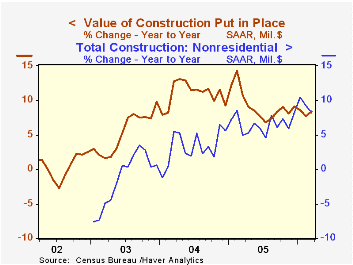
Public construction spending rose 0.2% for the second month though construction activity on highways & streets, nearly one third of the value of public construction spending, slipped 0.4% (4.9% y/y).
These more detailed categories represent the Census Bureau’s reclassification of construction activity into end-use groups. Finer detail is available for many of the categories; for instance, commercial construction is shown for Automotive sales and parking facilities, drugstores, building supply stores, and both commercial warehouses and mini-storage facilities. Note that start dates vary for some seasonally adjusted line items in 2000 and 2002 and that constant-dollar data are no longer computed.
| Construction Put-in-place | Mar | Feb | Y/Y | 2005 | 2004 | 2003 |
|---|---|---|---|---|---|---|
| Total | 0.9% | 1.0% | 8.4% | 9.2% | 10.9% | 5.4% |
| Private | 1.1% | 1.2% | 8.9% | 9.7% | 13.6% | 6.3% |
| Residential | 1.6% | 1.3% | 8.6% | 11.5% | 18.2% | 12.9% |
| Nonresidential | -0.1% | 1.1% | 9.6% | 5.4% | 3.9% | -5.4% |
| Public | 0.2% | 0.2% | 6.6% | 7.6% | 2.5% | 2.7% |
by Louise Curley May 1, 2006
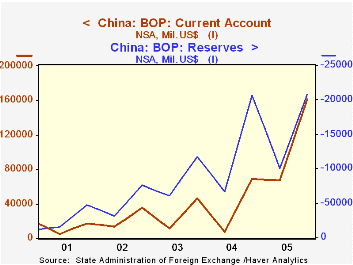
China's balance of payment data for 2005 were released today and, to no one's surprise, the current account surplus was a record--$160.8 billion, $67.2 billion in the first half of the year and $93.5 in the second half. For the year as a whole, the surplus was $92.2 billion above last year's surplus of $68.7 billion. (Data for China's balance of payments are reported only on a semi annual basis.)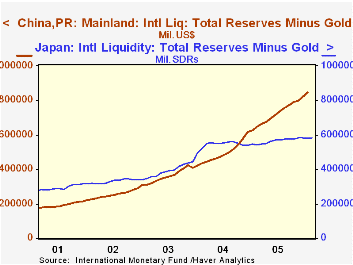
With its large current account surplus and a net inflow of capital, China has been piling up international reserves as can be seen in the first chart that compares the current account surplus with the increase in reserves. China is now the world's largest holder of international reserves having surpassed Japan in November 2004 as seen in the second chart.As of December, 2005, China's holdings of foreign reserves less gold amounted to $822 billion and the latest data for February, 2006, show a further rise to $856 billion.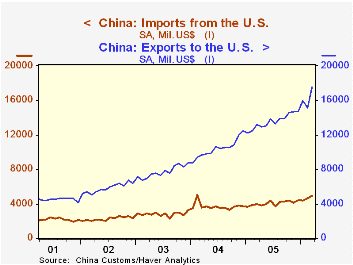
Data for China's trade through March 2006 was also released today. The widening gap between exports to and imports from the United States shows no sign of diminishing as can be seen in the third chart.
Data on China's trade and balance of payments may be found in the Haver CHINA and EMERGEPR data bases. The data on the balance of payments are identical in both data bases, but the data on trade are more detailed in the CHINA data base.
| China (Bil. US $) | Mar 06 | Feb 06 | Mar 05 | M/M % | Y/Y % | 2005 | 2004 | 2003 |
|---|---|---|---|---|---|---|---|---|
| Trade in Goods | ||||||||
| Exports | 77.9 | 70.1 | 61.0 | 11.1 | 29.7 | 762.0 | 593.3 | 438.2 |
| Imports | 63.2 | 66.4 | 52.3 | -4.8 | 20.8 | 660.0 | 561.2 | 412.8 |
| Balance | 14.7 | 3.7 | 8.6 | 11.0 dif | 6.1 dif | 102.0 | 32.1 | 25.5 |
| Balance with U. S. | 12.6 | 10.5 | 9.2 | 2.1 dif | 3.4 dif | 114.2 | 80.3 | 58.6 |
| Balance of Payments | H2 06 | H1 05 | H2 05 | H/H dif | Y/Y dif | 2005 | 2004 | 2003 |
| Current Account | 160.8 | 67.3 | 68.6 | 93.5 | 92.2 | 160.8 | 68.6 | 45.9 |
| Capital Account | 4.1 | 2.2 | -0.1 | 1.9 | 4.2 | 4.1 | -0.1 | -0.0 |
| Financial Account | 58.9 | 36.1 | 110.7 | 22.7 | 51.9 | 58.9 | 110.7 | 52.8 |
| Change in Reserves* | -207.0 | -100.5 | -206.4 | -106.6 | -0.6 | -207.0 | -206.4 | 117.0 |
| Errors & Omissions | -16.77 | -5.1 | 27.05 | -11.9 | -43.8 | -16.77 | 27.05 | 18.42 |

Tom Moeller
AuthorMore in Author Profile »Prior to joining Haver Analytics in 2000, Mr. Moeller worked as the Economist at Chancellor Capital Management from 1985 to 1999. There, he developed comprehensive economic forecasts and interpreted economic data for equity and fixed income portfolio managers. Also at Chancellor, Mr. Moeller worked as an equity analyst and was responsible for researching and rating companies in the economically sensitive automobile and housing industries for investment in Chancellor’s equity portfolio. Prior to joining Chancellor, Mr. Moeller was an Economist at Citibank from 1979 to 1984. He also analyzed pricing behavior in the metals industry for the Council on Wage and Price Stability in Washington, D.C. In 1999, Mr. Moeller received the award for most accurate forecast from the Forecasters' Club of New York. From 1990 to 1992 he was President of the New York Association for Business Economists. Mr. Moeller earned an M.B.A. in Finance from Fordham University, where he graduated in 1987. He holds a Bachelor of Arts in Economics from George Washington University.
More Economy in Brief

 Global| Feb 05 2026
Charts of the Week: Balanced Policy, Resilient Data and AI Narratives
by:Andrew Cates

