Global| May 01 2006
U.S. Income, Spending & Prices Firm in March
by:Tom Moeller
|in:Economy in Brief
Summary
Personal income increased 0.8% during March, double the Consensus expectation for a 0.4% rise and followed an unrevised 0.3% increase in February. The increase was the largest for any month since last September. A 5.3% (16.4% y/y) [...]
Personal income increased 0.8% during March, double the Consensus expectation for a 0.4% rise and followed an unrevised 0.3% increase in February. The increase was the largest for any month since last September.
A 5.3% (16.4% y/y) spike in health insurance benefits due to prescription drug benefits under the Medicare health-care program boosted transfer payments by 3.3% (9.3% y/y).
Wage & salary disbursements rose another 0.4% (5.0% y/y) lifted by a 0.5% (5.6% y/y) rise in private service sector wages. Factory wages rose 0.3% (2.4% y/y), the firmest gain since last October, while government sector wages grew 0.3% (3.3% y/y).
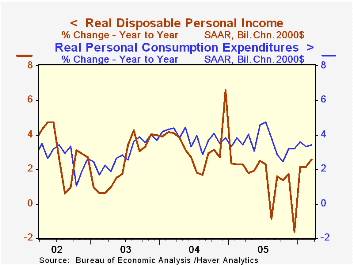
Disposable personal income jumped 0.8% (5.5% y/y) while personal taxes rose 0.8% (9.3% y/y). Adjusted for price inflation disposable income rose 0.5% (2.6% y/y) and real disposable income per capita jumped 0.4% (1.6% y/y).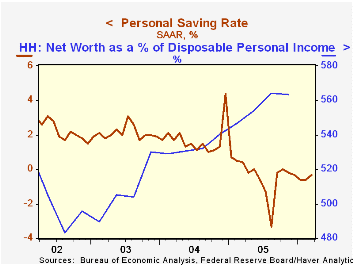
Personal consumption also was firm and increased 0.6% versus a Consensus expectation for a 0.4% rise. Adjusted for price inflation, spending rose 0.2% (3.4% y/y). Real spending on furniture & household equipment increased 0.9% (13.0% y/y) and "other" durable goods spending rose 1.8% (8.5% y/y). Spending on clothing & shoes fell for the second consecutive month and drooped 0.9% (+7.8% y/y) following several strong monthly gains between October and January. Spending on gasoline & oil fell 2.9% (-0.2% y/y and real services spending rose 0.4% (3.0% y/y).
The PCE chain price index rose 0.4% lifted by a 3.5% (16.5% y/y) jump in gasoline & oil prices. Prices for clothing & shoes surged 1.2% (-1.8% y/y), furniture & household equipment prices fell another 0.3% (-4.5% y/y) but motor vehicle & parts prices rose 0.2% (0.8% y/y).
Incentives and Prices for Motor Vehicles: What has been happening in recent years? is a Working Paper from the Federal Reserve Board and is available here.
The personal savings rate was a negative 0.3%.
Last week's testimony, Outlook for the U.S. Economy, by Federal Reserve Bank Chairman Ben S. Bernanke can be found here.
| Disposition of Personal Income | Mar | Feb | Y/Y | 2005 | 2004 | 2003 |
|---|---|---|---|---|---|---|
| Personal Income | 0.8% | 0.3% | 6.0% | 5.5% | 5.9% | 3.2% |
| Personal Consumption | 0.6% | 0.2% | 6.4% | 6.5% | 6.5% | 4.9% |
| Savings Rate | -0.3% | -0.6% | 0.4% (Mar '05) | -0.4% | 1.7% | 2.1% |
| PCE Chain Price Index | 0.4% | 0.1% | 2.9% | 2.8% | 2.6% | 1.9% |
| Less food & energy | 0.3% | 0.1% | 2.0% | 2.0% | 2.0% | 1.3% |

Tom Moeller
AuthorMore in Author Profile »Prior to joining Haver Analytics in 2000, Mr. Moeller worked as the Economist at Chancellor Capital Management from 1985 to 1999. There, he developed comprehensive economic forecasts and interpreted economic data for equity and fixed income portfolio managers. Also at Chancellor, Mr. Moeller worked as an equity analyst and was responsible for researching and rating companies in the economically sensitive automobile and housing industries for investment in Chancellor’s equity portfolio. Prior to joining Chancellor, Mr. Moeller was an Economist at Citibank from 1979 to 1984. He also analyzed pricing behavior in the metals industry for the Council on Wage and Price Stability in Washington, D.C. In 1999, Mr. Moeller received the award for most accurate forecast from the Forecasters' Club of New York. From 1990 to 1992 he was President of the New York Association for Business Economists. Mr. Moeller earned an M.B.A. in Finance from Fordham University, where he graduated in 1987. He holds a Bachelor of Arts in Economics from George Washington University.
More Economy in Brief